🏌️Nebius -> Optiecurve wijst op twee duidelijke opwaartse fases
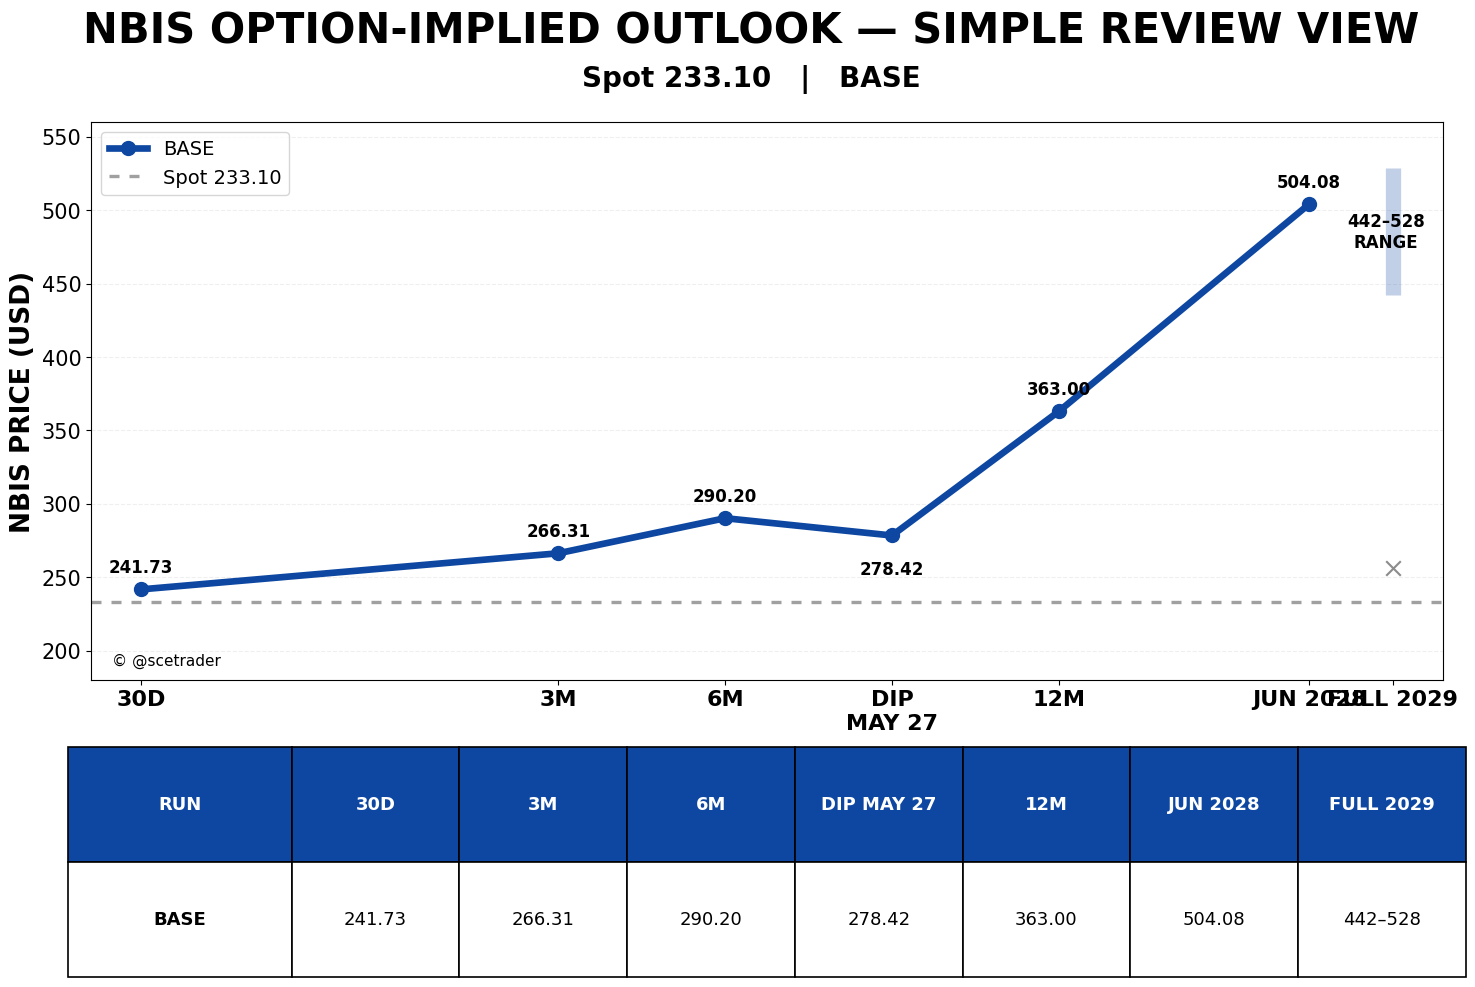
We zijn momenteel in bèta bezig met een model waarmee we aan de hand van opties proberen te berekenen waar de koers van een aandeel theoretisch naartoe zou kunnen bewegen. Het model gebruikt informatie uit verschillende looptijden in de optiemarkt en vertaalt die naar mogelijke koersniveaus voor de komende maanden en jaren.
Heb je vragen stuur gerust een appje, of naar info@scetrader.nl een mail.
De niveaus zijn modeluitkomsten uit de aangeleverde optieketen en geen officiële koersdoelen. Vooral langere looptijden moeten voorzichtiger worden gelezen wanneer quality of bandvalidatie afneemt.
Wil je alle artikelen kunnen lezen en elke podcast beluisteren? Neem dan een abonnement en krijg toegang tot alle artikelen en de database met duizenden berichten.
Nebius
Nebius noteert in deze analyse op $233,10. De optiecurve laat een duidelijk positief beeld zien, maar niet in de vorm van een rechte lijn omhoog. De afzonderlijke expiraties wijzen juist op een eerste stevige stijgingsfase, gevolgd door een periode van consolidatie en een beperkte terugval. Daarna ontstaat opnieuw een sterke opwaartse beweging richting 2028.
Dat patroon vinden we belangrijker dan één extreem koersdoel aan de lange kant. De optiemarkt rekent bij Nebius met uitzonderlijk hoge volatiliteit, waardoor de bandbreedtes zeer groot zijn. Het centrale pad blijft duidelijk positief, maar tijdelijke correcties moeten nadrukkelijk worden ingecalculeerd.
Algemeen beeld
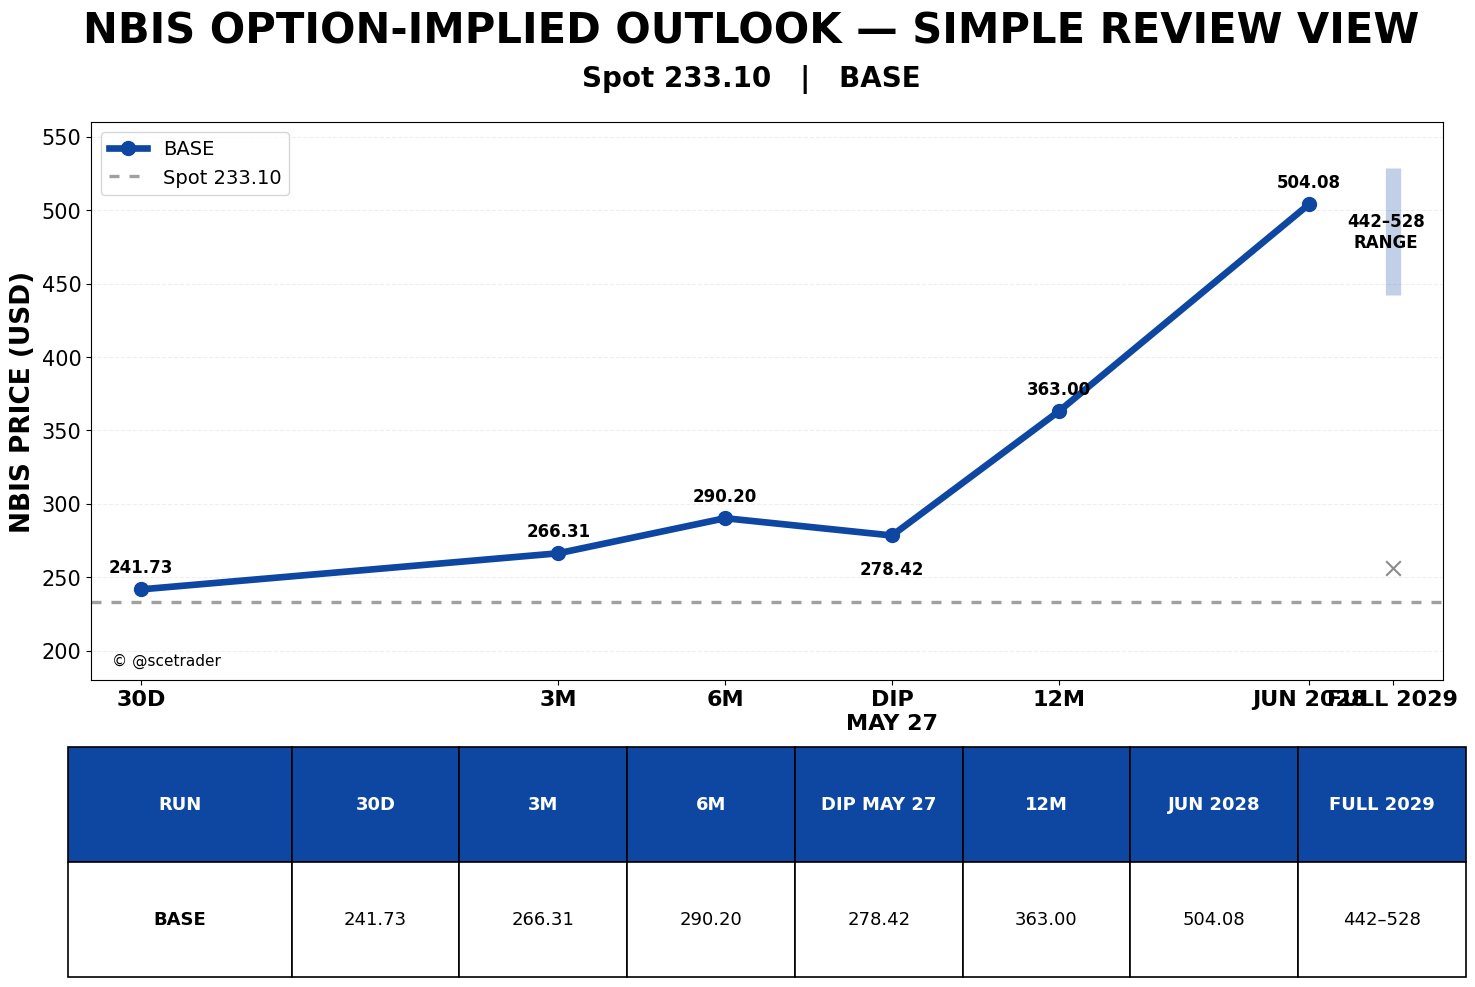
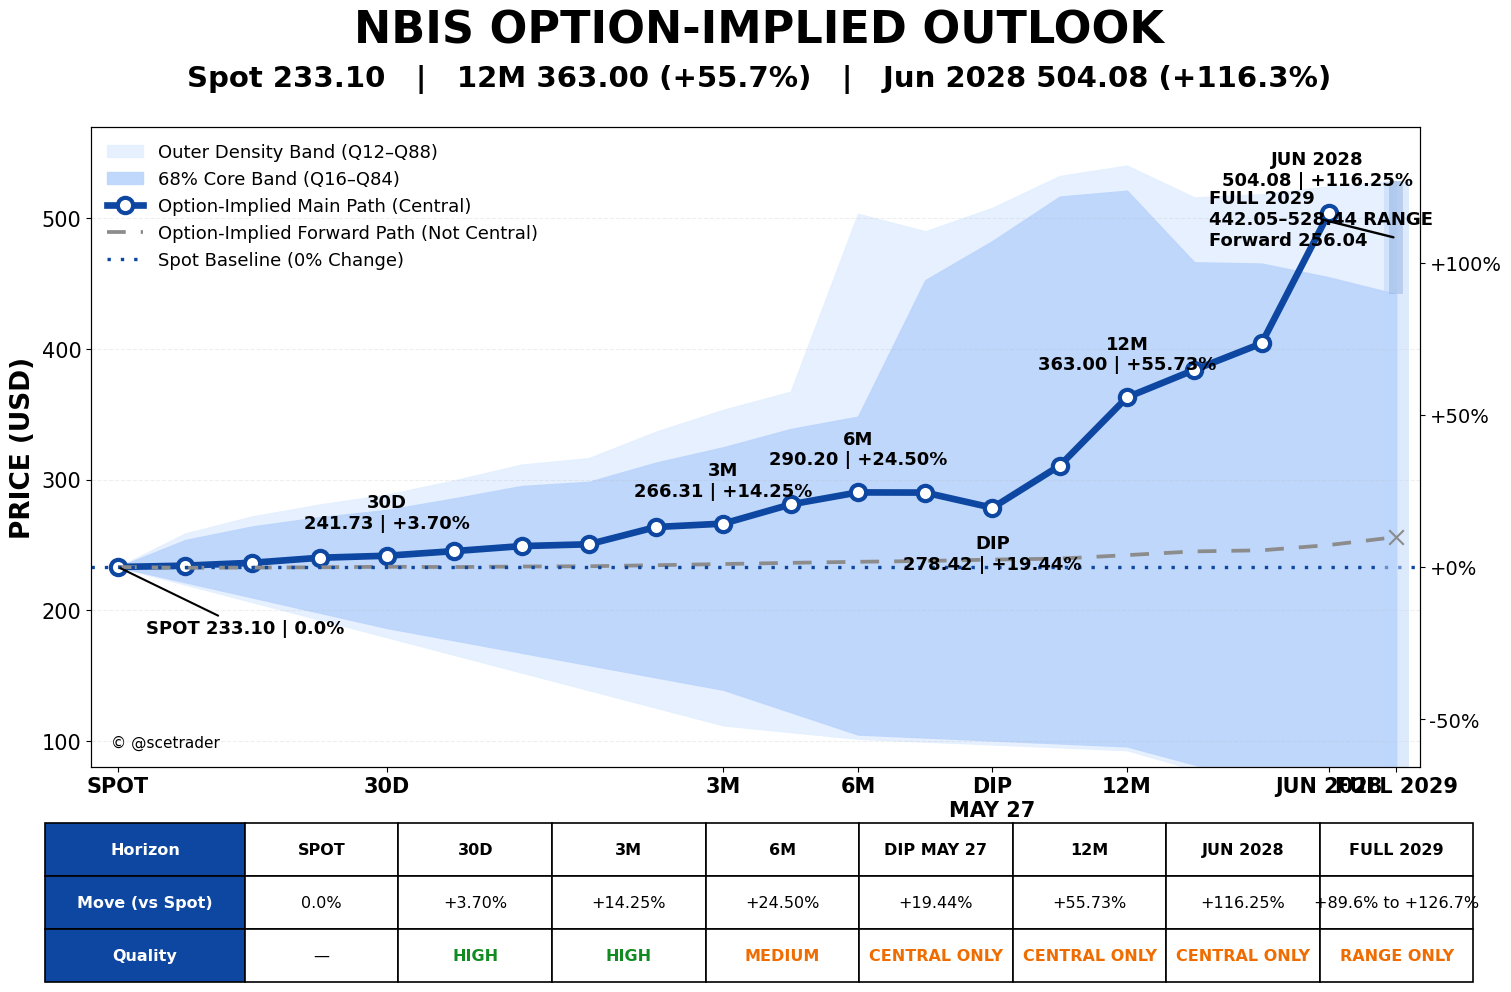
Vanaf de actuele koers van $233,10 stijgt het centrale optiepad naar $241,73 op 30 dagen. Rond drie maanden ligt het niveau op $266,31 en in maart 2027 op ongeveer $290,20.
Daarna vlakt de beweging duidelijk af. April 2027 blijft vrijwel onveranderd rond $290,07, waarna het centrale niveau in mei terugvalt naar $278,42.
Die dip is relevant omdat ook de directionele tilt in dezelfde periode verzwakt. Het beeld is daarmee niet alleen een beweging in het centrale prijsniveau; ook de onderliggende optie-informatie wijst tijdelijk op minder overtuigende opwaartse druk.
Vanaf juni 2027 verandert het patroon opnieuw. Het centrale niveau stijgt naar $310,71, vervolgens naar $363,00 in september 2027 en $384,00 in december. Januari 2028 komt uit op $404,27 en juni 2028 op $504,08.
Het beeld bestaat daarmee uit twee duidelijke fases: eerst een sterke stijging, daarna consolidatie en een dip, gevolgd door een tweede en uiteindelijk sterkere stijgingsfase.
Overzicht
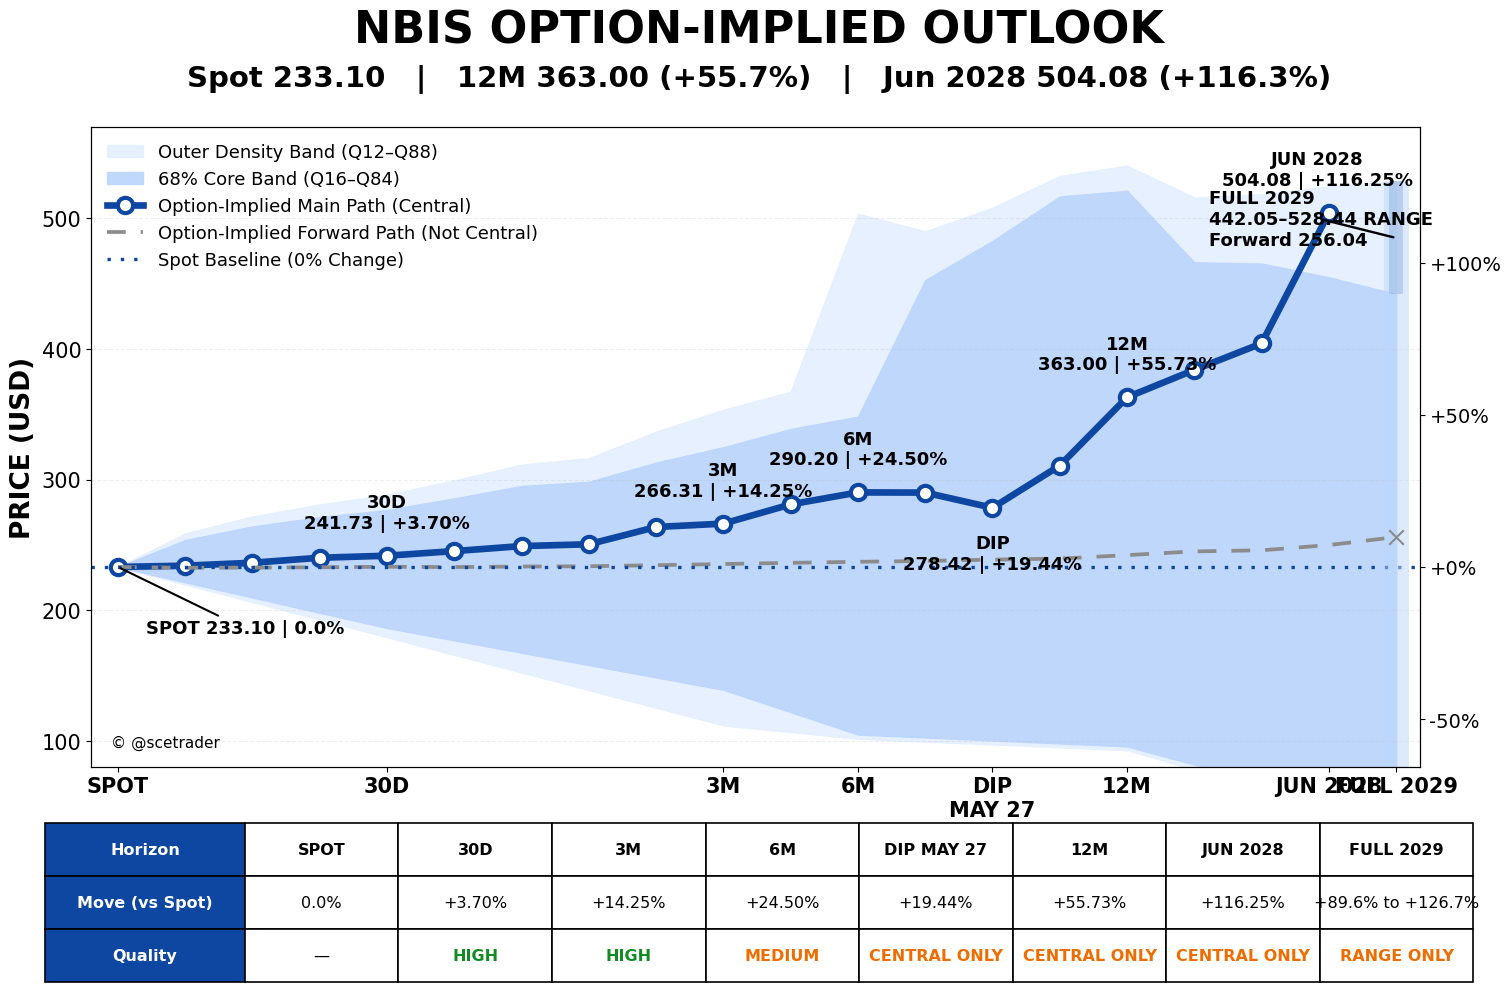
| Horizon | Centraal niveau | Vanaf spot |
|---|---|---|
| Spot | $233,10 | 0,00% |
| 30D | $241,73 | +3,70% |
| 3M | $266,31 | +14,25% |
| 6M | $290,20 | +24,50% |
| mei 2027 | $278,42 | +19,44% |
| 12M | $363,00 | +55,73% |
| januari 2028 | $404,27 | +73,43% |
| juni 2028 | $504,08 | +116,25% |
| FULL 2029 | $442-$528 band | zeer brede distributie |
30 dagen: eerste opwaartse stap
Op 30 dagen ligt het centrale niveau op $241,73, ongeveer 3,7% boven de huidige koers. Dat is nog geen spectaculaire beweging, maar de eerste expiraties laten vrijwel zonder uitzondering een oplopend pad zien.
De directionele tilt ligt op deze horizon rond 0,821 en is daarmee duidelijk positief. De korte kant van de optiecurve ondersteunt dus een opwaarts scenario.
3 maanden: versnelling
Rond drie maanden stijgt het centrale niveau naar $266,31. Dat ligt ruim 14% boven spot.
De beweging versnelt daarmee duidelijk ten opzichte van de eerste maand. Ook de directionele tilt blijft positief. De optiecurve laat in deze fase geen neutraal patroon zien, maar een duidelijke voorkeur voor hogere niveaus.
6 maanden: richting $290
In maart 2027 komt het centrale niveau uit op ongeveer $290,20, ruim 24% boven de actuele koers.
De curve stijgt daarmee verder, maar het tempo begint af te nemen. Dit is de overgang naar de consolidatiefase die in april en mei duidelijker zichtbaar wordt.
Consolidatie en dip
Na maart verandert het patroon.
April blijft vrijwel vlak rond $290,07. In mei zakt het centrale niveau vervolgens terug naar $278,42.
Ook de directionele tilt verzwakt in deze periode. Deze daalt van ongeveer 0,686 in maart naar 0,580 in april en vervolgens naar circa 0,372 in mei.
Dat maakt deze correctie inhoudelijk belangrijk. De optiecurve geeft niet alleen een lager centraal niveau aan, maar tegelijkertijd ook minder sterke directionele overtuiging.
Voor een aandeel met de volatiliteit van Nebius is zo'n tijdelijke terugval logisch. De langere trend blijft positief, maar de weg omhoog wordt nadrukkelijk niet als lineair geprijsd.
12 maanden: tweede stijgingsfase
Vanaf juni ontstaat opnieuw duidelijke kracht.
Het centrale niveau stijgt eerst naar $310,71 en vervolgens naar $363,00 rond september 2027. Dat laatste niveau ligt ongeveer 55,7% boven spot.
De directionele tilt trekt tegelijkertijd weer aan. Daarmee wordt de tweede opwaartse fase door meerdere onderdelen van de optiecurve bevestigd.
Richting 2028
De stijging zet daarna verder door.
December 2027 komt uit op ongeveer $384,00 en januari 2028 op $404,27. Voor juni 2028 ligt het centrale niveau zelfs op $504,08.
Dat betekent een stijging van ruim 116% ten opzichte van de huidige koers.
Het is belangrijk om dat niveau in de juiste context te plaatsen. De implied volatility blijft uitzonderlijk hoog en de bandbreedtes rondom het centrale pad zijn daardoor zeer groot. $504 is dus geen klassiek koersdoel, maar het centrale punt binnen een zeer brede door opties geïmpliceerde verdeling.
Langste looptijd
Voor januari 2029 wordt het beeld minder eenduidig.
De directionele tilt is daar niet meer betrouwbaar beschikbaar en ook de direction source valt weg. Daardoor vinden we het niet verantwoord om één exact centraal koersdoel te publiceren.
De lange distributie blijft wel duidelijk breed:
Q84 ligt rond $442
Q88 ligt rond $528
Forward ligt rond $256
De combinatie hiervan laat zien hoe groot de onzekerheid aan de lange kant wordt.
Daarom gebruiken we voor FULL 2029 geen exact centraal niveau, maar een brede bovenzone van ongeveer $442 tot $528 als relevante long-end band. De optiemarkt laat dus nog steeds aanzienlijke upside toe, maar onvoldoende directionele informatie om daar één exact eindpunt aan te koppelen.
Het volledige koerspad
Het meest realistische optiepad voor Nebius is daarmee:
$233 → $242 → $266 → $290 → $278 → $311 → $363 → $404 → $504
De kern is helder: eerst een sterke stijging, daarna consolidatie en een tijdelijke dip, gevolgd door een tweede krachtige opwaartse fase.
Dit vinden we aanzienlijk geloofwaardiger dan een kunstmatig rechte lijn omhoog. De optiecurve blijft duidelijk positief, maar de zeer hoge volatiliteit maakt tussentijdse bewegingen van tientallen procenten mogelijk.
English
Nebius: options curve points to two distinct upward phases
Nebius starts from a reference price of $233.10. The options curve remains clearly positive, but it does not imply a straight-line advance. Individual expirations instead point to an initial strong upward phase, followed by consolidation and a moderate pullback, before a second and ultimately stronger advance into 2028.
This structure is more important than assigning a single extreme long-term price target. Nebius options price exceptionally high volatility, resulting in very wide distributions. The central path remains strongly positive, but substantial interim corrections must be expected.
General view
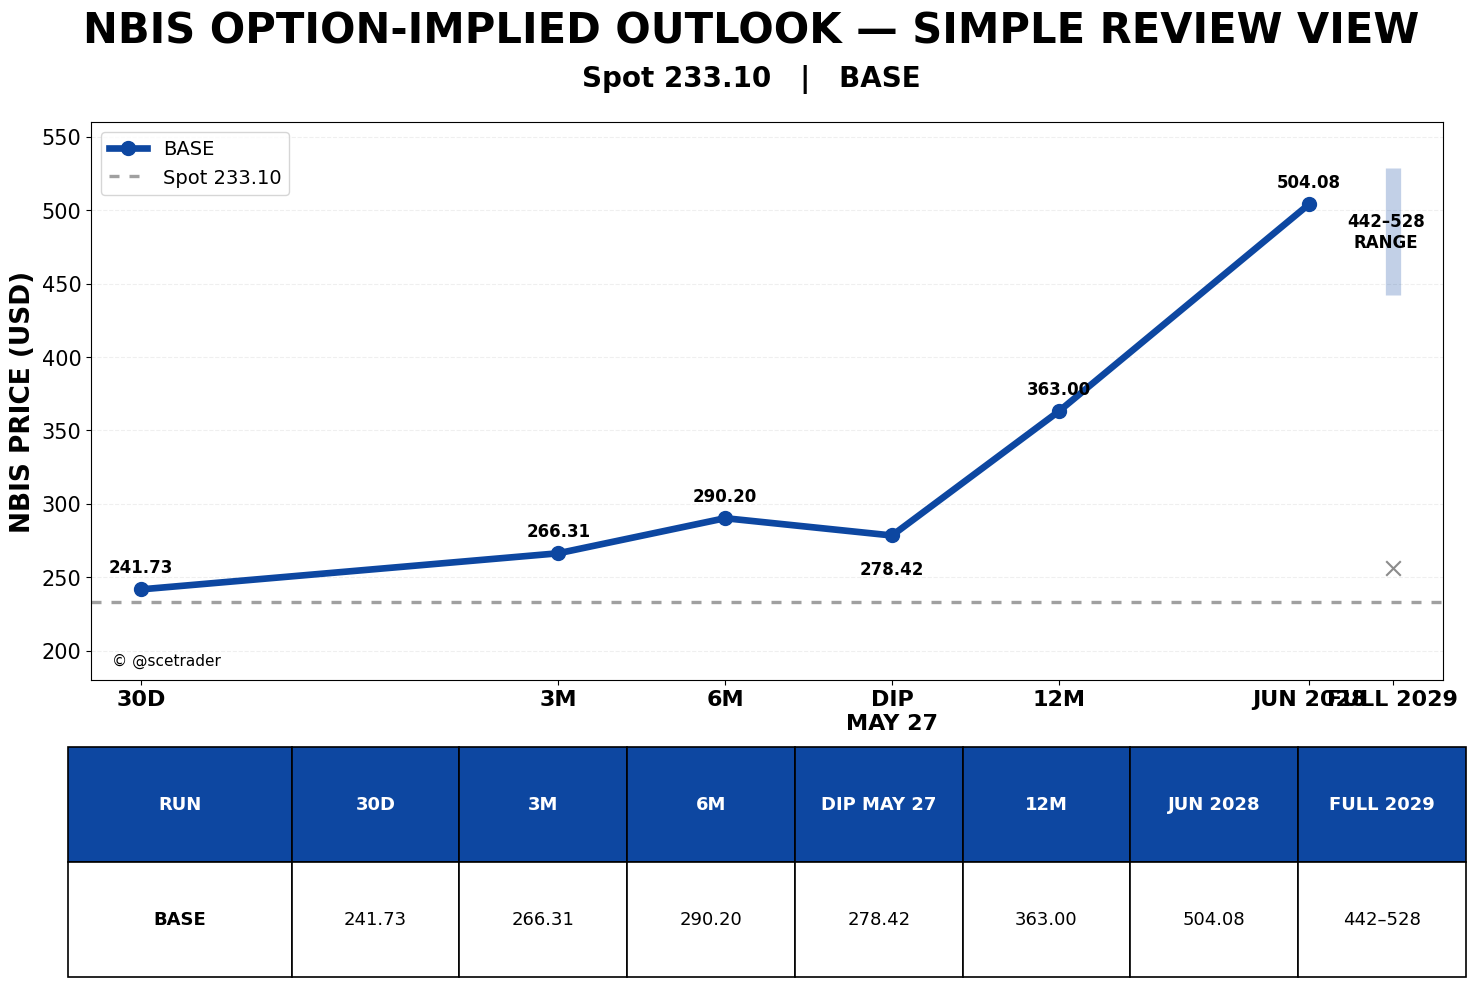
From the current price of $233.10, the central option-implied path rises to $241.73 at 30 days. Around three months the level reaches $266.31 and by March 2027 approximately $290.20.
The move then clearly starts to flatten. April 2027 remains almost unchanged at $290.07 before the central level falls to $278.42 in May.
This dip is relevant because directional tilt weakens at the same time. The change is therefore not limited to the central price path; the underlying directional options signal also becomes less convincing temporarily.
From June 2027 onward, the structure strengthens again. The central level rises to $310.71, then to $363.00 in September 2027 and $384.00 in December. January 2028 reaches $404.27 and June 2028 reaches $504.08.
The overall structure therefore consists of two distinct phases: a strong initial advance, followed by consolidation and a pullback, and then a second and ultimately stronger upward phase.
Overview
| Horizon | Central level | From spot |
|---|---|---|
| Spot | $233.10 | 0.00% |
| 30D | $241.73 | +3.70% |
| 3M | $266.31 | +14.25% |
| 6M | $290.20 | +24.50% |
| May 2027 | $278.42 | +19.44% |
| 12M | $363.00 | +55.73% |
| January 2028 | $404.27 | +73.43% |
| June 2028 | $504.08 | +116.25% |
| FULL 2029 | $442-$528 band | very wide distribution |
30 days: first upward step
At 30 days, the central level is $241.73, approximately 3.7% above the current share price. This is not yet an extreme move, but the first expirations almost uniformly produce a rising path.
Directional tilt stands at approximately 0.821 and is therefore clearly positive. The short end of the options curve supports an upward scenario.
3 months: acceleration
Around three months the central level rises to $266.31, more than 14% above spot.
The move therefore accelerates materially compared with the first month. Directional tilt also remains positive. At this stage the options curve does not indicate a neutral structure, but a clear preference for higher levels.
6 months: toward $290
By March 2027, the central level reaches approximately $290.20, more than 24% above the current share price.
The curve continues higher, although the rate of increase starts to slow. This marks the transition toward the consolidation phase that becomes clearer in April and May.
Consolidation and pullback
The structure changes after March.
April remains almost flat near $290.07. The central level then declines to $278.42 in May.
Directional tilt also weakens during this period. It falls from approximately 0.686 in March to 0.580 in April and then to around 0.372 in May.
This makes the correction meaningful. The options curve not only produces a lower central level, but also shows less directional conviction at the same time.
For a stock with the volatility profile of Nebius, such a temporary pullback is reasonable. The longer-term path remains positive, but the market is clearly not pricing a linear advance.
12 months: second upward phase
Clear strength reappears from June onward.
The central level initially rises to $310.71 and subsequently to $363.00 around September 2027. The latter is approximately 55.7% above spot.
Directional tilt also recovers. The second upward phase is therefore supported by multiple components of the options structure.
Into 2028
The advance continues.
December 2027 reaches approximately $384.00 and January 2028 $404.27. By June 2028, the central level rises as far as $504.08.
That represents an increase of more than 116% from the current share price.
This level needs to be placed in the proper context. Implied volatility remains exceptionally high and the distribution around the central path is therefore extremely wide. $504 should not be read as a conventional price target, but as the central point within a broad option-implied distribution.
Longest maturity
The picture becomes less directional by January 2029.
Directional tilt is no longer reliably available and the directional source also disappears. We therefore do not consider it appropriate to publish one exact central price target.
The long-dated distribution remains extremely broad:
Q84 around $442
Q88 around $528
Forward around $256
This combination shows how much uncertainty increases at the far end of the curve.
For FULL 2029 we therefore use a broad upper range of approximately $442 to $528 rather than a single central level. The options market still allows for substantial upside, but no longer provides sufficient directional information to assign one precise terminal price.
The full price path
The most realistic option-implied path for Nebius is therefore:
$233 → $242 → $266 → $290 → $278 → $311 → $363 → $404 → $504
The message is clear: a strong initial rise, followed by consolidation and a temporary pullback, before a second powerful upward phase.
This is considerably more credible than forcing the stock into a straight upward line. The options curve remains clearly positive, while the exceptionally high volatility means that interim moves of several tens of percent remain entirely possible.
Disclaimer Aan de door ons opgestelde informatie kan op geen enkele wijze rechten worden ontleend. Alle door ons verstrekte informatie en analyses zijn geheel vrijblijvend. Alle consequenties van het op welke wijze dan ook toepassen van de informatie blijven volledig voor uw eigen rekening.
Wij aanvaarden geen aansprakelijkheid voor de mogelijke gevolgen of schade die zouden kunnen voortvloeien uit het gebruik van de door ons gepubliceerde informatie. U bent zelf eindverantwoordelijk voor de beslissingen die u neemt met betrekking tot uw beleggingen.


