🏌️ Marvell -> Sterke optiecurve, tijdelijke terugval en daarna grote sprong
We zijn momenteel in bèta bezig met een model waarmee we aan de hand van opties proberen te berekenen waar de koers van een aandeel theoretisch naartoe zou kunnen bewegen. Het model gebruikt informatie uit verschillende looptijden in de optiemarkt en vertaalt die naar mogelijke koersniveaus voor de komende maanden en jaren.
Heb je vragen stuur gerust een appje, of naar info@scetrader.nl een mail.
Lumentum Holdings noteert in deze berekening op 942,37 dollar. 30D→3M: duidelijke stijging; 3M→6M: duidelijke stijging; 6M→12M: sterke opwaartse sprong; 12M→FULL 2029: sterke opwaartse sprong.
De niveaus zijn modeluitkomsten uit de aangeleverde optieketen en geen officiële koersdoelen. Vooral langere looptijden moeten voorzichtiger worden gelezen wanneer quality of bandvalidatie afneemt.
Wil je alle artikelen kunnen lezen en elke podcast beluisteren? Neem dan een abonnement en krijg toegang tot alle artikelen en de database met duizenden berichten.
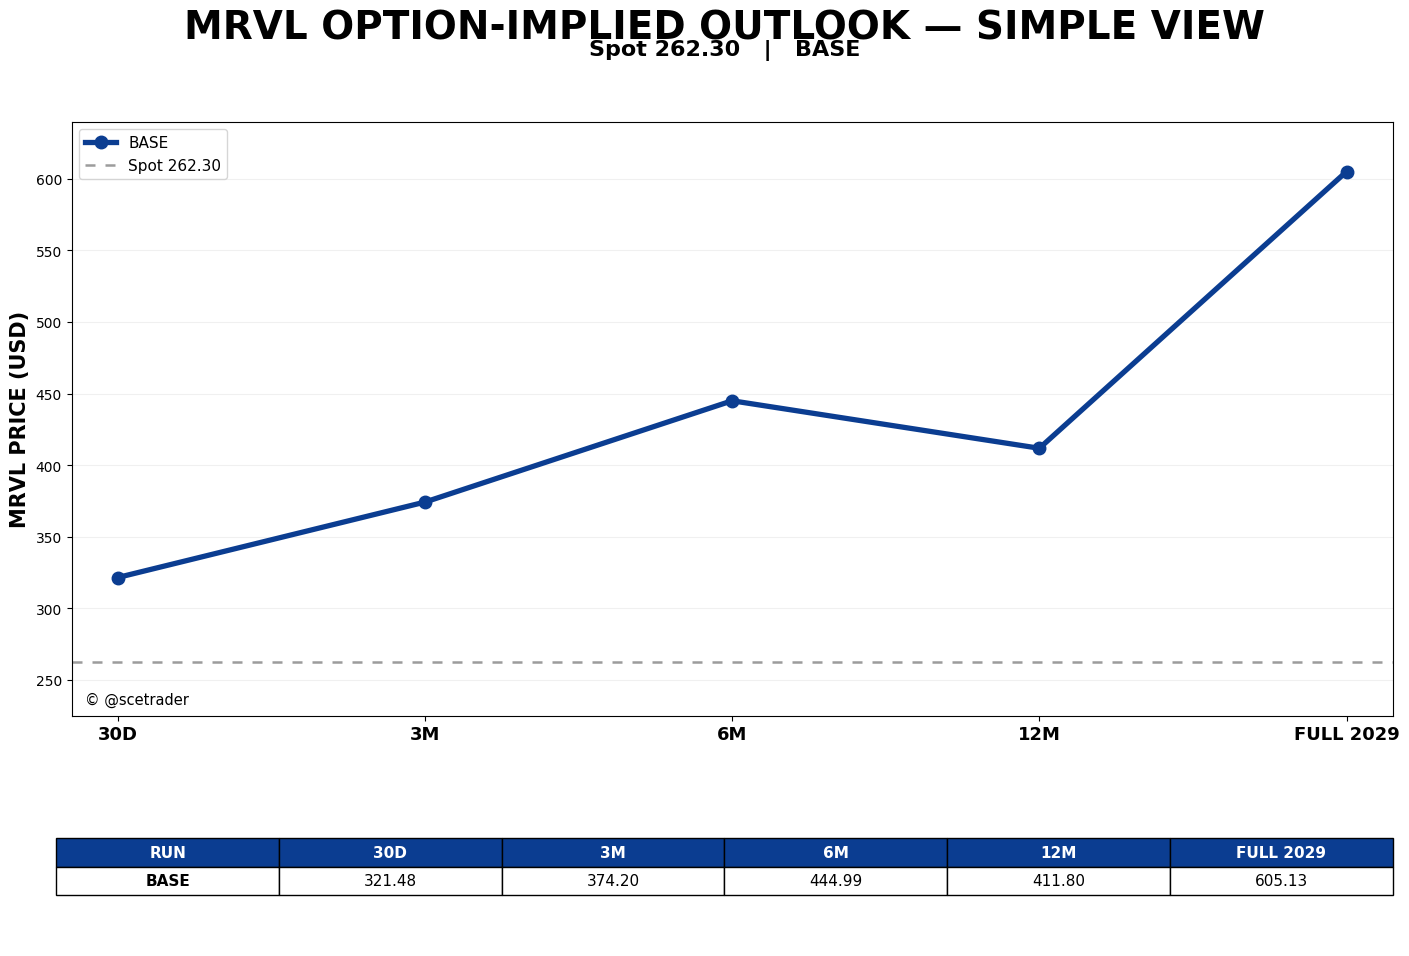
Marvell noteert in deze berekening op 262,30 dollar. De optiecurve loopt al op korte termijn duidelijk boven spot, versnelt vervolgens sterk richting drie en zes maanden, koelt op twaalf maanden af en maakt daarna op de langste looptijd opnieuw een uitzonderlijk grote opwaartse sprong.
De niveaus zijn modeluitkomsten uit de aangeleverde optieketen en geen officiële koersdoelen. Vooral de uiterste lange looptijden moeten voorzichtiger worden gelezen wanneer de volledige bandvalidatie ontbreekt.
Algemeen beeld
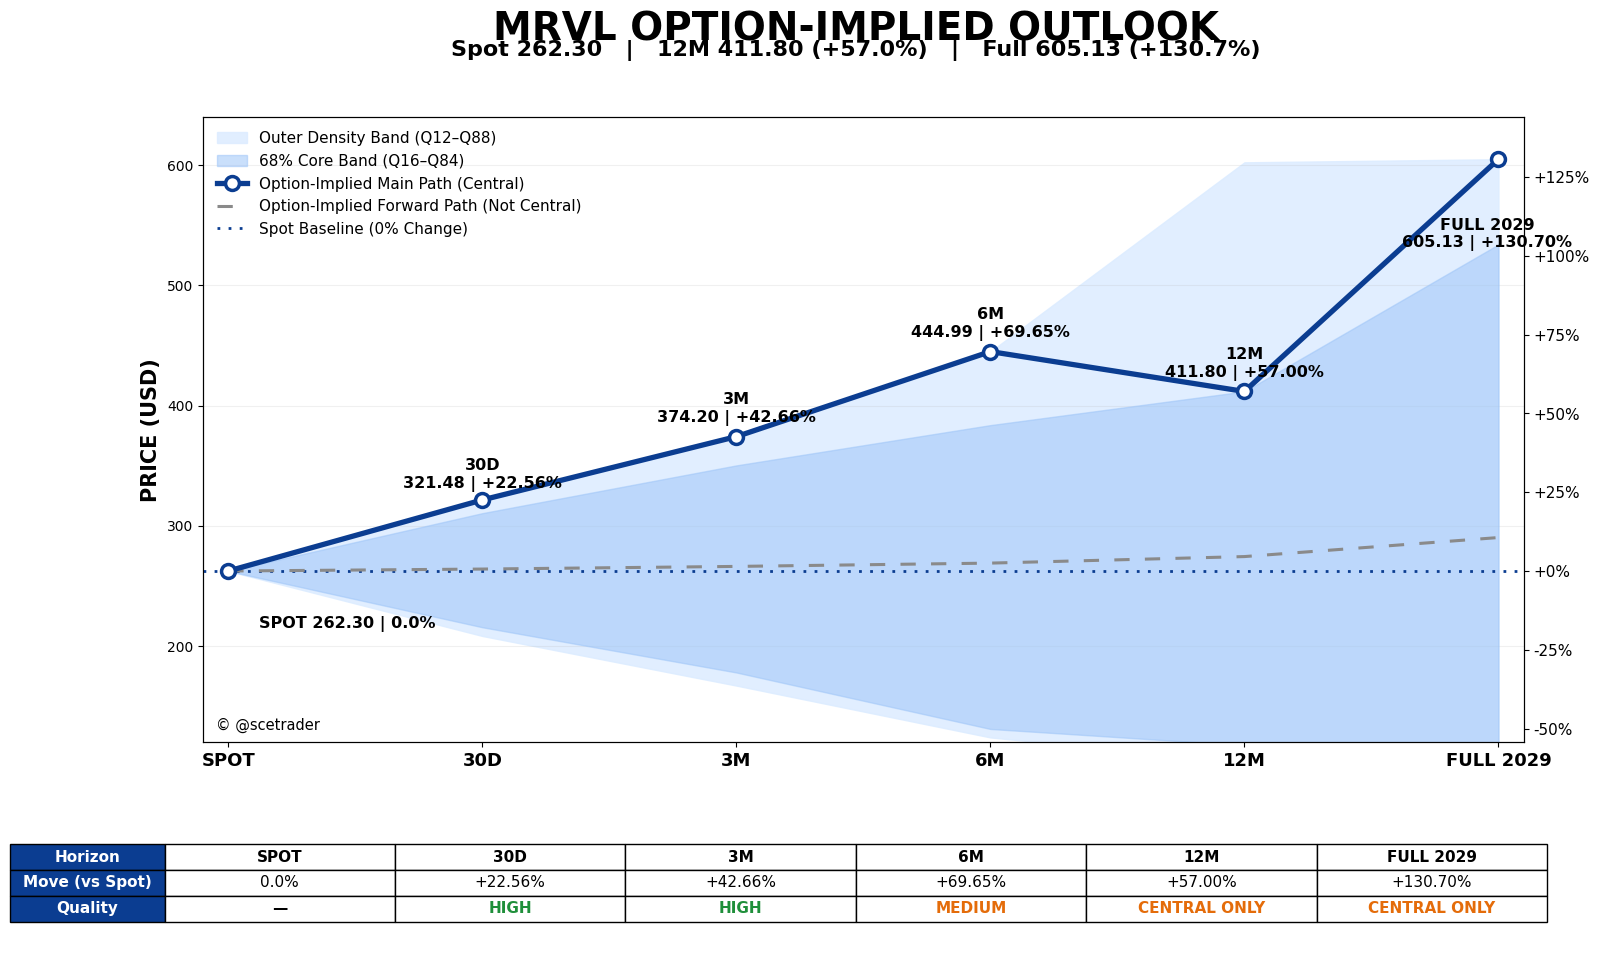
De ATM implied volatility ligt over de vijf gebruikte horizons grofweg tussen 64,9% en 67,1%. Daarmee blijft de verwachte uitkomstenruimte over de volledige curve zeer breed.
De directionele tilt is op iedere horizon positief. Die loopt van +0,402 op 30D naar +0,723 op 3M, +0,603 op 6M, +0,669 op 12M en +0,362 op FULL. De richting blijft dus positief, maar de precieze kracht verschilt sterk per looptijd.
Overzicht
| Horizon | Main path | Vanaf spot | Expiry | Quality |
|---|---|---|---|---|
| 30D | 321,48 | +22,56% | 30 oktober 2026 | HIGH |
| 3M | 374,20 | +42,66% | 15 januari 2027 | HIGH |
| 6M | 444,99 | +69,65% | 16 april 2027 | MEDIUM |
| 12M | 411,80 | +57,00% | 17 september 2027 | CENTRAL ONLY |
| FULL 2029 | 605,13 | +130,70% | 19 januari 2029 | CENTRAL ONLY |
30 dagen: direct sterke opwaartse asymmetrie
Het centrale gepubliceerde niveau ligt op 321,48 dollar, 22,56% boven de huidige koers van 262,30 dollar. De curve begint daarmee al op korte termijn duidelijk positief.
De Forward ligt op 263,94 dollar en de ATM IV rond 65,3%. De directionele tilt bedraagt +0,402 en is duidelijk positief.
De Q16–Q84-band loopt van 215,50 tot 310,46 dollar en de Q12–Q88-band tot 321,48 dollar aan de bovenkant. De bandvalidatie is positief en de quality is HIGH.
3 maanden: sterke opwaartse sprong
Het Main path stijgt naar 374,20 dollar, 42,66% boven spot. Ten opzichte van 30D komt er 52,71 dollar bij, een stijging van 16,40% tussen beide horizons.
De Forward ligt op 266,14 dollar en de ATM IV rond 64,9%. De directionele tilt bedraagt +0,723 en is sterk positief.
De Q16–Q84-band loopt van 177,85 tot 350,22 dollar en de Q12–Q88-band tot 374,20 dollar. De bandvalidatie is positief en de quality is HIGH.
6 maanden: opnieuw een sterke sprong
Op zes maanden stijgt het pad naar 444,99 dollar, 69,65% boven spot. Vanaf 3M bedraagt de stijging nog eens 70,79 dollar, of 18,92%.
De Forward ligt op 268,89 dollar en de ATM IV rond 65,9%. De directionele tilt blijft met +0,603 sterk positief.
De Q16–Q84-band loopt van 130,83 tot 383,75 dollar en de Q12–Q88-band tot 444,99 dollar. De bandvalidatie is positief. De quality is MEDIUM, waardoor de richting goed zichtbaar is maar de exacte omvang minder zwaar moet worden gewogen dan bij HIGH.
12 maanden: duidelijke terugval na de sterke stijging
Op twaalf maanden komt het Main path uit op 411,80 dollar, 57,00% boven spot. Ten opzichte van 6M daalt de route 33,19 dollar, of 7,46%.
De Forward ligt op 274,33 dollar en de ATM IV rond 67,1%. De directionele tilt blijft met +0,669 sterk positief. De terugval in de Main betekent dus niet dat de directionele optie-informatie negatief is geworden; de vorm van de geselecteerde density-route koelt alleen duidelijk af.
De volledige outer-band validation ontbreekt. De quality is daarom CENTRAL ONLY en vooral de richting en de vorm van de curve zijn hier relevanter dan het exacte niveau.
Langste looptijd: uitzonderlijk grote nieuwe opwaartse sprong
Op FULL 2029 stijgt het Main path naar 605,13 dollar, 130,70% boven de huidige koers. Vanaf 12M is dat een sprong van 193,33 dollar, of 46,95%.
De Forward ligt op 290,17 dollar en de ATM IV rond 67,1%. De directionele tilt blijft positief op +0,362, al is deze minder sterk dan op de middellange horizons.
De Q16–Q84-band loopt indicatief van 78,16 tot 534,17 dollar, terwijl Q88 op 605,13 dollar ligt. De volledige bandvalidatie ontbreekt en de quality is CENTRAL ONLY. Het zeer hoge eindniveau moet daarom worden gelezen als een krachtige long-end upper-density route, niet als een klassiek koersdoel met dezelfde betrouwbaarheid als de kortere gevalideerde horizons.
Het volledige koerspad
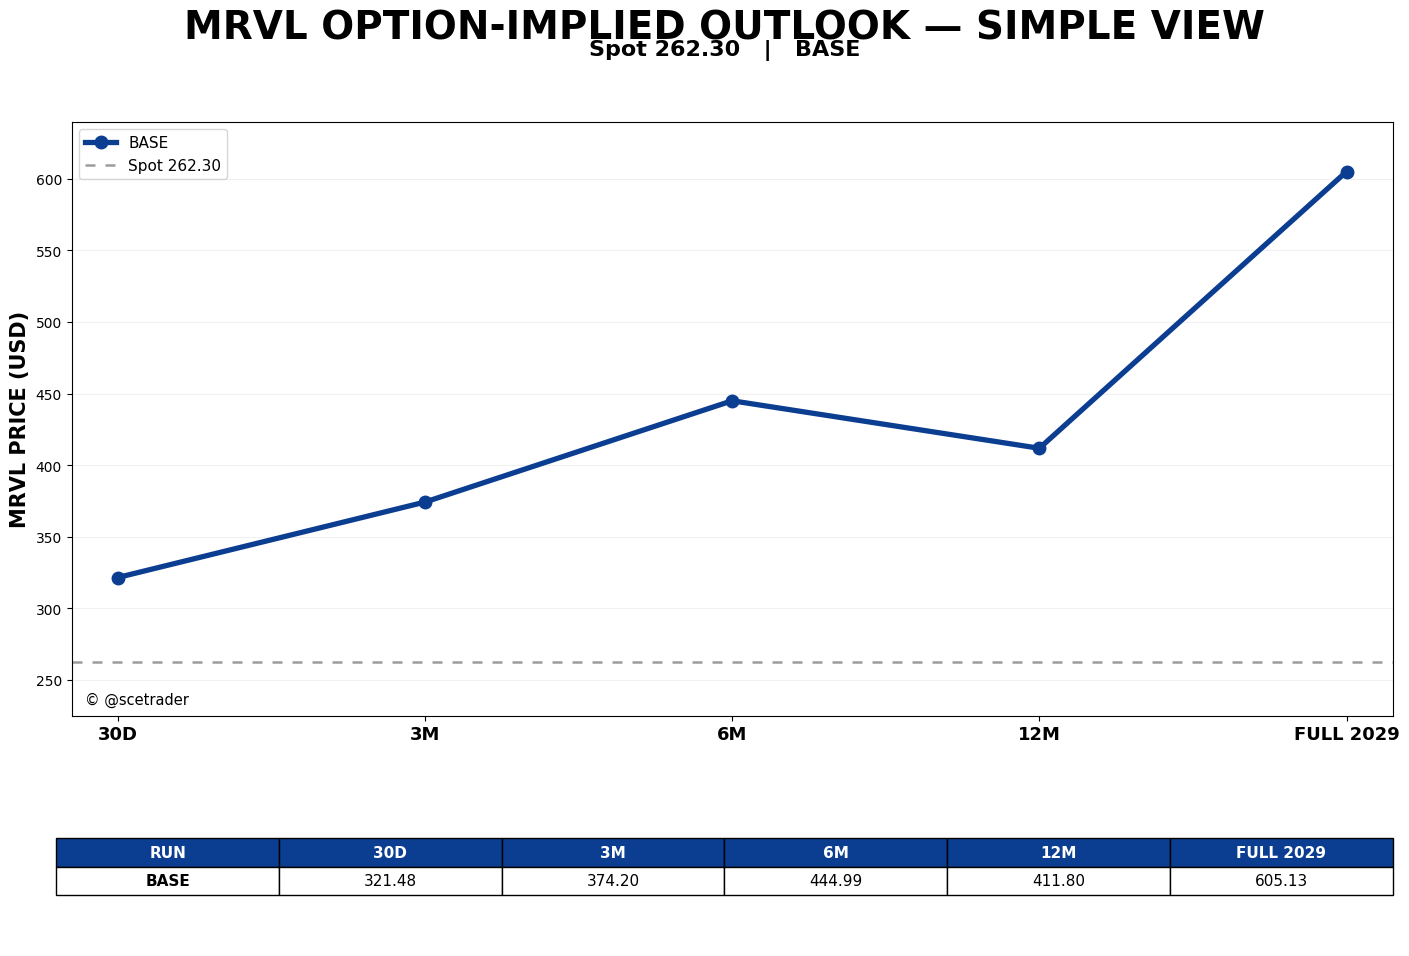
Het volledige pad loopt van 321,48 dollar op 30D naar 374,20 dollar op 3M en vervolgens 444,99 dollar op 6M. Op twaalf maanden volgt een duidelijke terugval naar 411,80 dollar. Daarna versnelt de curve opnieuw zeer sterk naar 605,13 dollar op FULL 2029.
De vorm is daardoor belangrijker dan een eenvoudige lineaire bullish conclusie. De chain laat eerst een zeer sterke opbouw zien, daarna tijdelijke afkoeling en vervolgens een veel grotere long-end upside-tail. De laatste horizon heeft wel CENTRAL ONLY-quality, zodat de richting sterker is bevestigd dan de exacte omvang van het eindniveau.
English
Marvell: strong options curve, temporary 12-month pullback and another major long-end jump
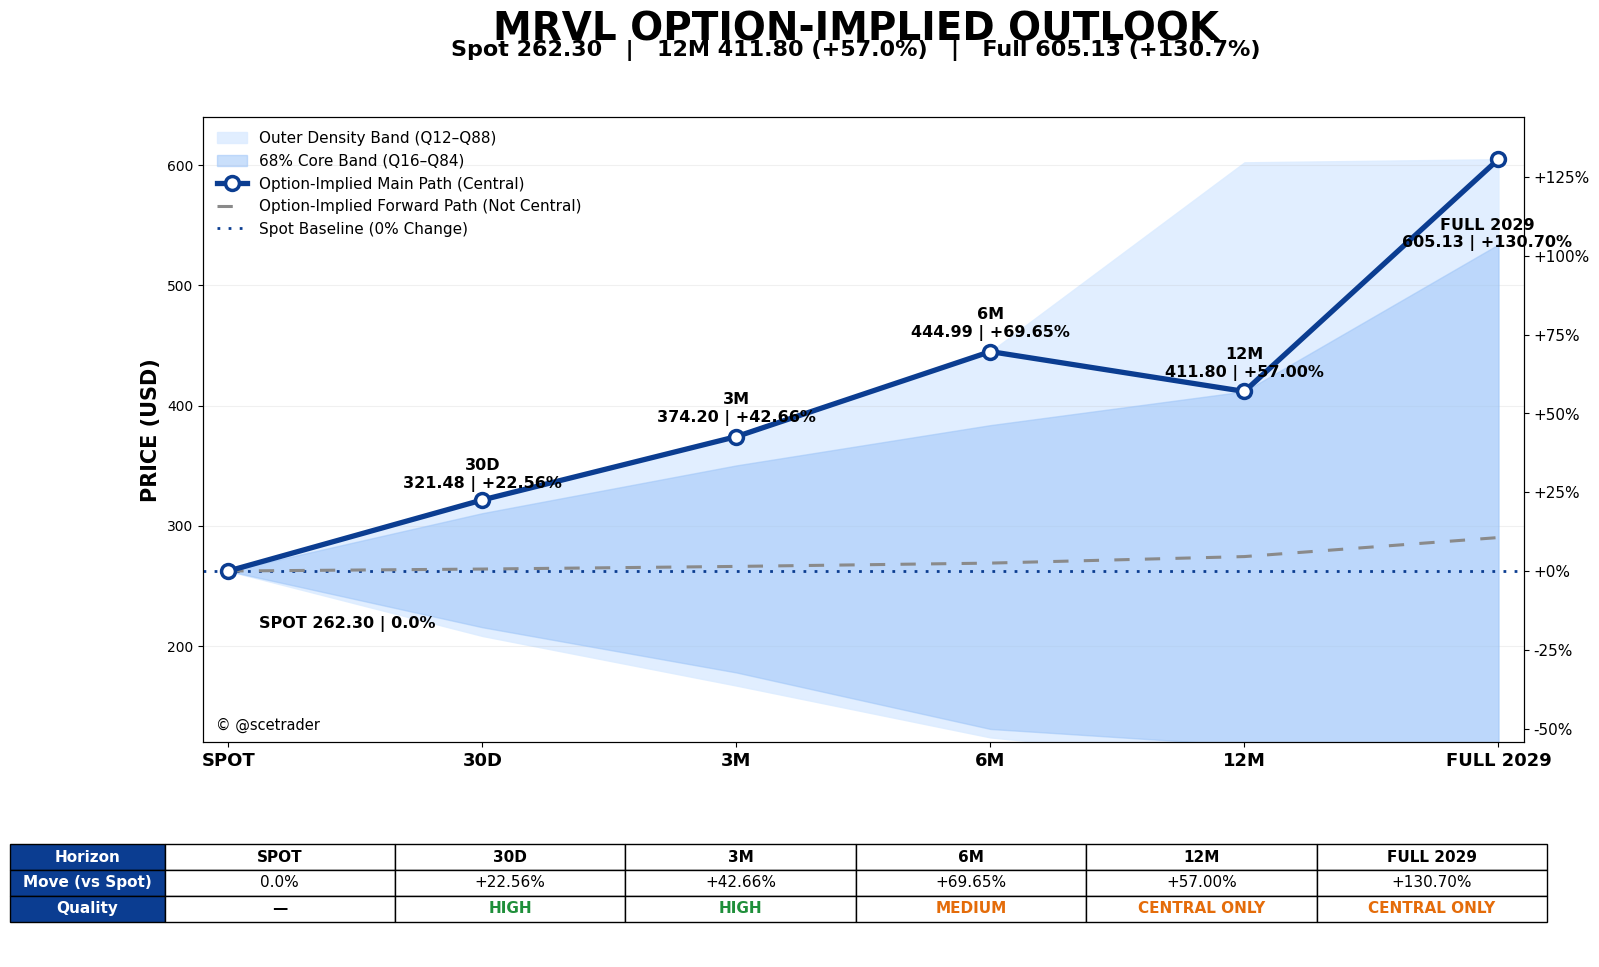
Marvell starts from a reference price of $262.30. The options curve is already clearly above spot at the short end, accelerates strongly into three and six months, cools at twelve months and then makes another exceptionally large upward jump at the longest maturity.
These levels are model outputs derived from the supplied options chain and are not official price targets. The furthest maturities deserve additional caution when full band validation is unavailable.
ATM implied volatility ranges roughly from 64.9% to 67.1% across the five selected horizons. The expected distribution of outcomes therefore remains very wide throughout the curve.
Directional tilt is positive at every horizon. It moves from +0.402 at 30D to +0.723 at 3M, +0.603 at 6M, +0.669 at 12M and +0.362 at FULL. Direction remains positive throughout, although the strength of the signal varies materially by maturity.
Overview
| Horizon | Main path | From spot | Expiry | Quality |
|---|---|---|---|---|
| 30D | $321.48 | +22.56% | October 30, 2026 | HIGH |
| 3M | $374.20 | +42.66% | January 15, 2027 | HIGH |
| 6M | $444.99 | +69.65% | April 16, 2027 | MEDIUM |
| 12M | $411.80 | +57.00% | September 17, 2027 | CENTRAL ONLY |
| FULL 2029 | $605.13 | +130.70% | January 19, 2029 | CENTRAL ONLY |
30 days: immediately strong upside asymmetry
The published central level is $321.48, 22.56% above the current share price of $262.30. The curve therefore starts with a clearly positive short-term profile.
The Forward is $263.94 and ATM IV is around 65.3%. Directional tilt is +0.402 and clearly positive.
The Q16–Q84 band runs from $215.50 to $310.46 and the Q12–Q88 band reaches $321.48 at the upper end. Band validation is positive and quality is HIGH.
3 months: strong upward jump
The Main path rises to $374.20, 42.66% above spot. Compared with 30D, the path gains $52.71, an increase of 16.40% between the two horizons.
The Forward is $266.14 and ATM IV is around 64.9%. Directional tilt is +0.723 and strongly positive.
The Q16–Q84 band runs from $177.85 to $350.22 and the Q12–Q88 band reaches $374.20. Band validation is positive and quality is HIGH.
6 months: another strong jump
At six months, the path rises to $444.99, 69.65% above spot. The increase from 3M is another $70.79, or 18.92%.
The Forward is $268.89 and ATM IV is around 65.9%. Directional tilt remains strongly positive at +0.603.
The Q16–Q84 band runs from $130.83 to $383.75 and the Q12–Q88 band reaches $444.99. Band validation is positive. Quality is MEDIUM, so direction is clear while the exact magnitude deserves less weight than at HIGH-quality horizons.
12 months: clear pullback after the strong rise
At twelve months, the Main path is $411.80, 57.00% above spot. Relative to 6M, the route declines by $33.19, or 7.46%.
The Forward is $274.33 and ATM IV is around 67.1%. Directional tilt remains strongly positive at +0.669. The decline in the Main therefore does not mean that directional option information has turned negative; the selected density route simply cools materially at this horizon.
Full outer-band validation is unavailable. Quality is therefore CENTRAL ONLY and the direction and shape of the curve are more informative than the precise level.
Longest maturity: exceptionally large new upward jump
At FULL 2029, the Main path rises to $605.13, 130.70% above the current share price. From 12M, that represents a jump of $193.33, or 46.95%.
The Forward is $290.17 and ATM IV is around 67.1%. Directional tilt remains positive at +0.362, although it is weaker than at the medium-term horizons.
The Q16–Q84 band runs indicatively from $78.16 to $534.17, while Q88 is $605.13. Full band validation is unavailable and quality is CENTRAL ONLY. The very high terminal level should therefore be read as a powerful long-end upper-density route rather than as a conventional price target carrying the same reliability as the shorter validated horizons.
The full price path
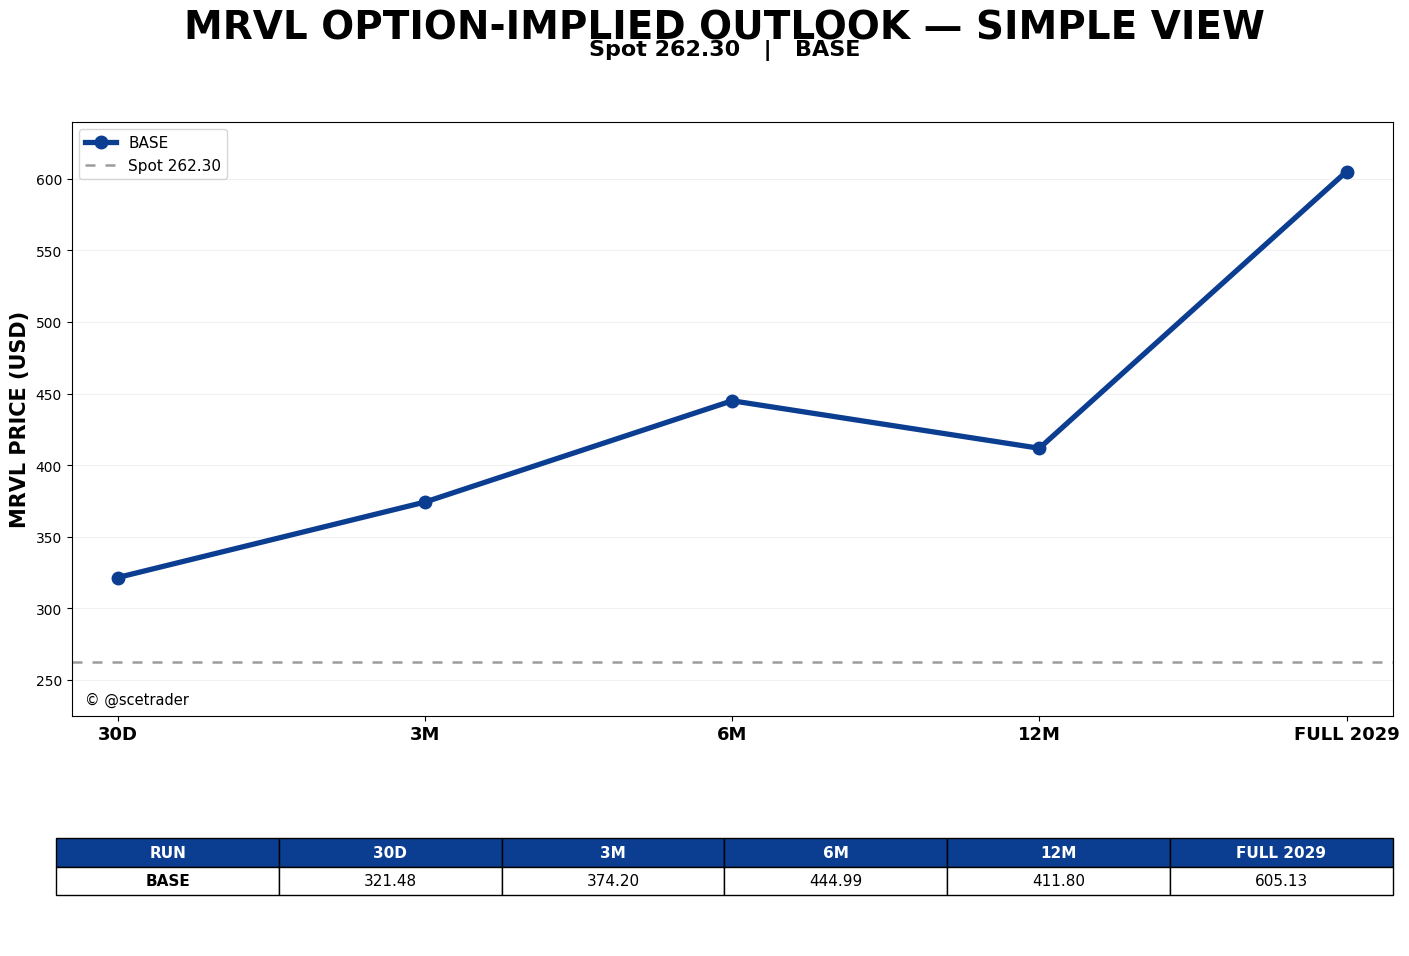
The complete path moves from $321.48 at 30D to $374.20 at 3M and then $444.99 at 6M. A clear pullback follows at twelve months to $411.80. The curve then accelerates sharply again to $605.13 at FULL 2029.
The shape is therefore more important than a simple linear bullish conclusion. The chain first shows very strong upside expansion, then temporary cooling, followed by a much larger long-end upside tail. The final horizon carries CENTRAL ONLY quality, meaning direction is more robust than the precise magnitude of the terminal level.
Disclaimer Aan de door ons opgestelde informatie kan op geen enkele wijze rechten worden ontleend. Alle door ons verstrekte informatie en analyses zijn geheel vrijblijvend. Alle consequenties van het op welke wijze dan ook toepassen van de informatie blijven volledig voor uw eigen rekening.
Wij aanvaarden geen aansprakelijkheid voor de mogelijke gevolgen of schade die zouden kunnen voortvloeien uit het gebruik van de door ons gepubliceerde informatie. U bent zelf eindverantwoordelijk voor de beslissingen die u neemt met betrekking tot uw beleggingen.


