🏓 VIX: Zakt terug, maar de korte termijn blijft grilliger dan hoofdlijn suggereert
De nieuwe volatiliteitsdata laten een duidelijk rustiger marktbeeld zien. De VIX daalt 12,04% naar 18,92, VVIX zakt 9,45% naar 92,40 en VXHY valt 11,84% terug naar 6,18. Dat wijst op minder brede stress in aandelen, volatiliteitsopties en high yield-krediet. De nuance zit bij VXST, want de 9-daagse VIX daalt wel hard, maar blijft met 19,69 boven de gewone VIX staan. Dat betekent dat de markt op korte termijn nog steeds meer beweging prijst dan het headline-volatiliteitsbeeld alleen laat zien.
Wil je alle artikelen kunnen lezen en elke podcast beluisteren? Neem dan een abonnement en krijg toegang tot alle artikelen en de database met duizenden berichten.
Investment view
■ Wij blijven voorzichtig constructief voor risk assets zolang VIX onder 20 blijft en VVIX niet terug boven 100 uitbreekt.
■ De daling van VIX met 12,04% naar 18,92 wijst op afnemende aandelenstress, maar de stand blijft hoog genoeg om niet te spreken van volledige rust.
■ VXST daalt 17,68%, maar blijft met 19,69 boven VIX. Dat houdt de korte termijn gevoeliger voor nieuws, macrodata en plotselinge intraday-bewegingen.
■ VXHY daalt 11,84% naar 6,18 en bevestigt dat high yield-krediet op dit moment geen bredere risk-off beweging aanjaagt.
■ VXEF daalt slechts 0,27% naar 18,44 en blijft onder de dalende trendlijn. Internationale aandelenstress neemt niet toe, maar de daling is minder overtuigend dan bij Amerikaanse volatiliteit.
De totale volatiliteitsstructuur is daarmee beter dan de afgelopen stressfase, maar nog niet volledig ontspannen. Voor beleggers betekent dit dat zwakte in sterke aandelen koopbaar kan blijven, vooral als dalingen niet worden bevestigd door een nieuwe stijging in VIX, VVIX en VXHY. Toch blijft de korte looptijd belangrijk. VXST boven VIX geeft aan dat de markt de komende dagen nog steeds relatief veel beweging verwacht. Dat past bij een markt waarin de grotere trend kan verbeteren, maar waarin tactische positionering belangrijk blijft.
VIX
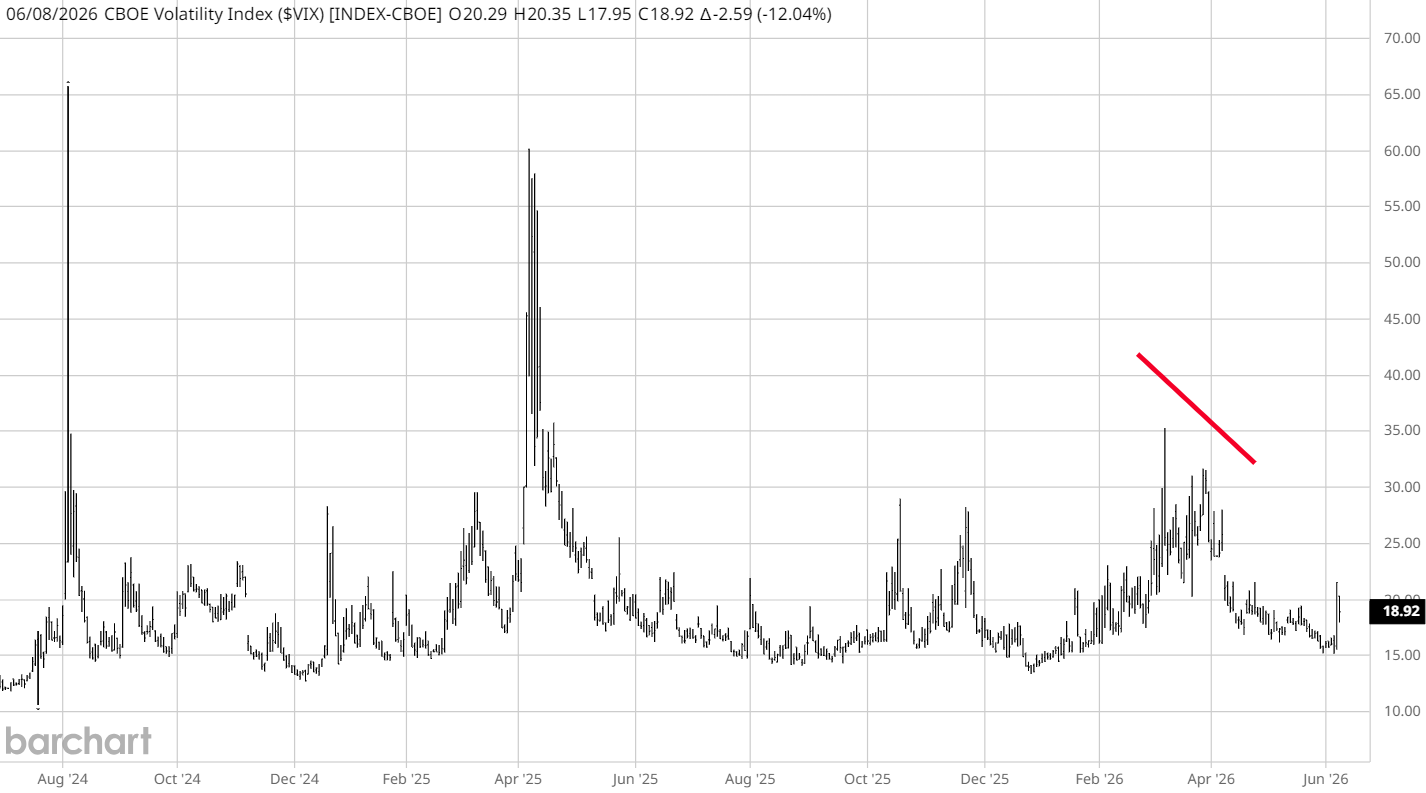
■ Laatste stand: 18,92, met een dagdaling van 2,59 punt.
■ Procentuele beweging: -12,04%.
■ Korte trend: scherp lager na de recente opleving.
■ 5-daagse trend: terug richting de zone onder 20.
■ Maandtrend: lager binnen de dalende structuur vanaf de eerdere piek.
■ Duiding: afnemende stress, geen bevestiging van een brede trenddraai naar paniek.
De VIX meet de verwachte volatiliteit op de S&P 500 en blijft de belangrijkste graadmeter voor Amerikaanse aandelenstress. De daling van 12,04% naar 18,92 is een sterk signaal. De markt prijst minder bescherming en beweegt opnieuw onder de belangrijke grens van 20. Dat is positief voor aandelen, omdat veel systematische en optiegerelateerde druk juist toeneemt wanneer VIX structureel boven 20 blijft.
De beweging past binnen de dalende trend op de chart. De eerdere stijging richting hogere niveaus is niet doorgezet en de index blijft ruim onder de piekzone van de afgelopen maanden. Toch is 18,92 geen extreem laag niveau. De markt is dus rustiger, maar niet volledig ontspannen. Voor aandelen betekent dit dat dips beter kunnen worden opgevangen, terwijl snelle bewegingen nog mogelijk blijven als macrodata, rente of geopolitiek opnieuw druk geven.
VXST
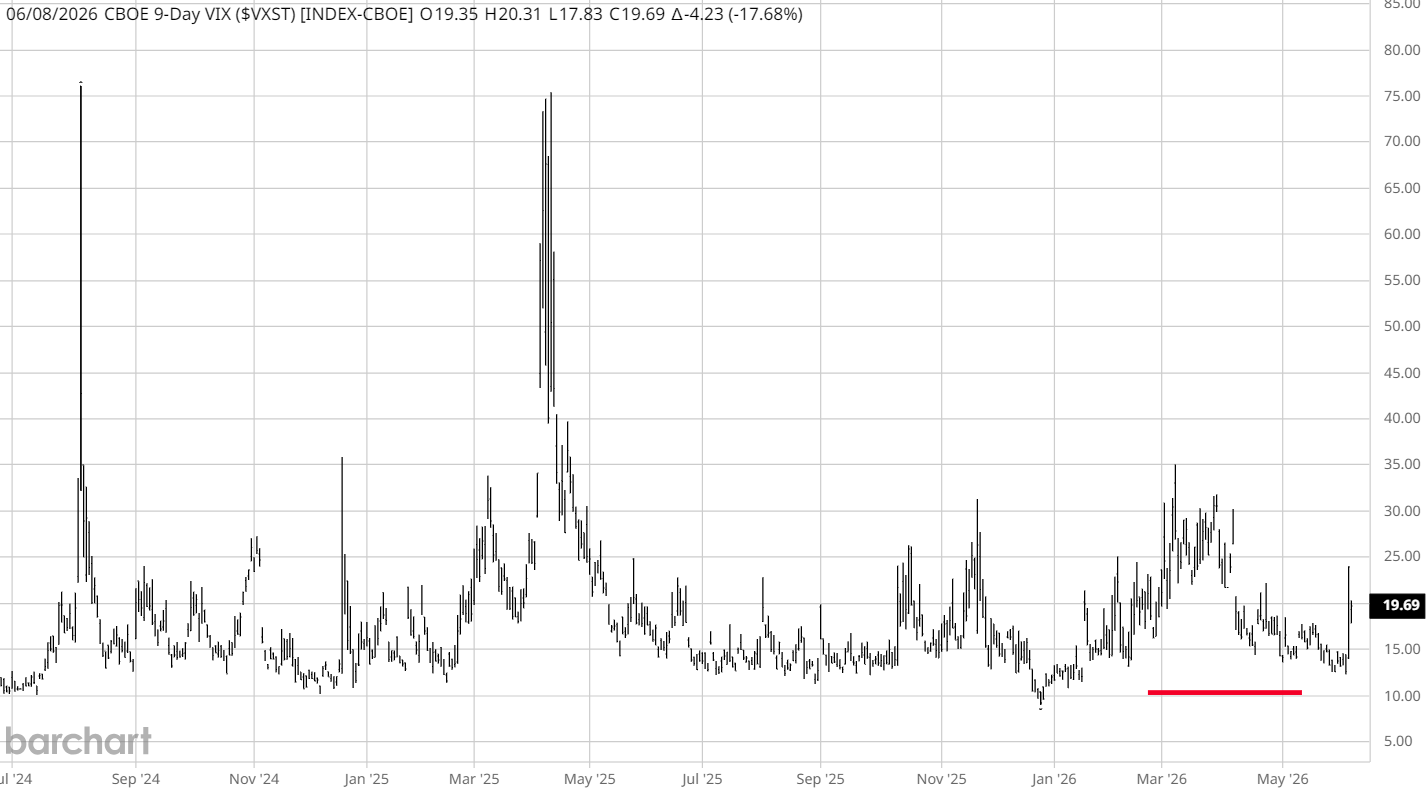
■ Laatste stand: 19,69, met een dagdaling van 4,23 punt.
■ Procentuele beweging: -17,68%.
■ Korte trend: fors lager na een recente korte stresspiek.
■ 5-daagse trend: nog altijd beweeglijk, met steun hoger dan de rustige zone rond 10 tot 14.
■ Maandtrend: lager dan de eerdere piek, maar nog niet terug naar volledige rust.
■ Duiding: korte termijnstress neemt af, maar blijft hoger dan de gewone VIX.
VXST meet de 9-daagse verwachte volatiliteit op de S&P 500 en is daardoor gevoeliger voor directe marktstress dan de gewone VIX. De daling van 17,68% naar 19,69 is krachtig en laat zien dat de directe paniek uit de markt loopt. Toch blijft VXST boven de gewone VIX staan. Dat is belangrijk, omdat de markt voor de komende dagen nog steeds meer beweging prijst dan voor de bredere 30-daagse volatiliteitsperiode.
Dit is geen bearish signaal op zichzelf, maar wel een waarschuwing voor de korte termijn. Beleggers moeten rekening houden met meer intraday-volatiliteit, vooral rond macrodata, renteverwachtingen en grote indexniveaus. Voor handelaren betekent dit dat koopkansen op zwakte interessant kunnen blijven, maar dat posities strak moeten worden beheerd. De markt is rustiger, maar nog niet volledig stabiel.
VVIX
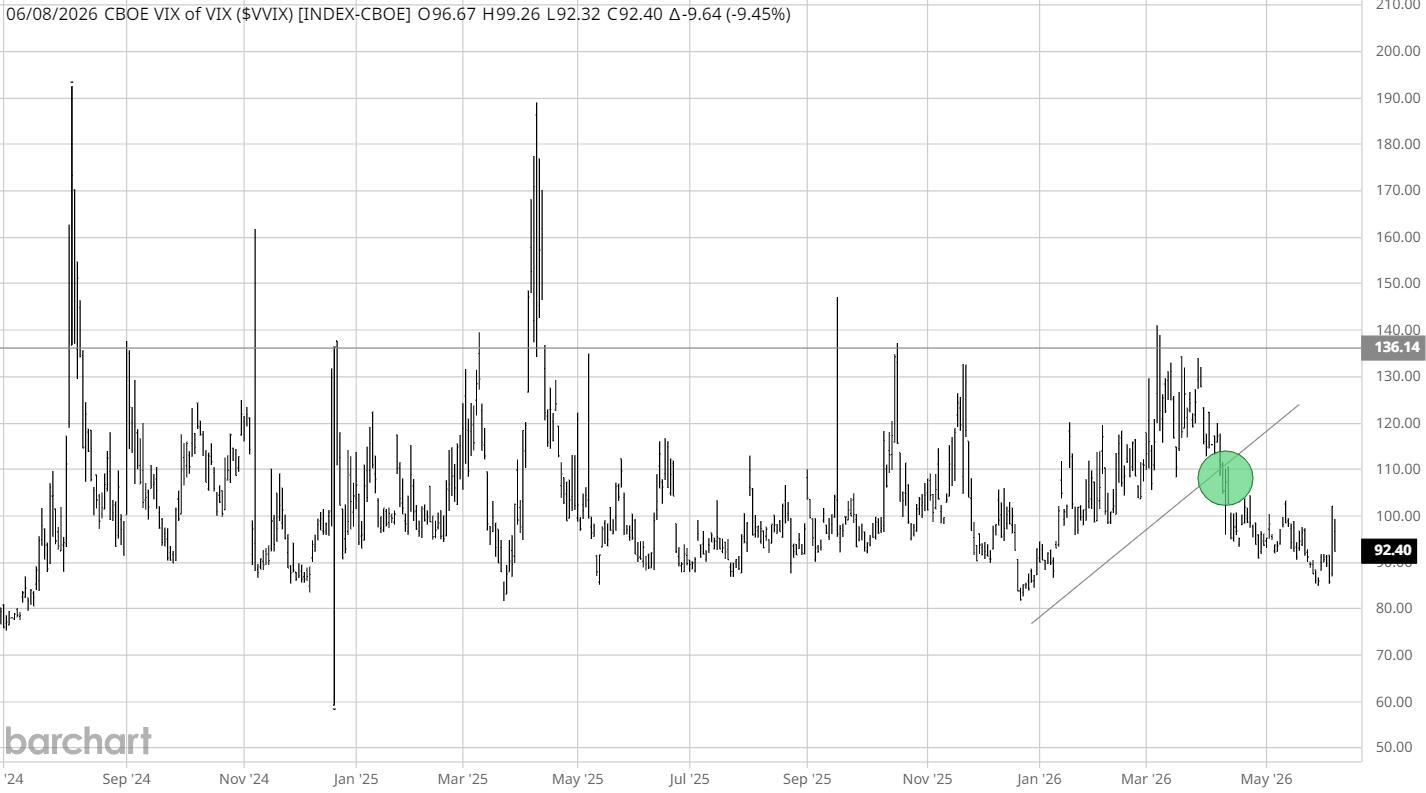
■ Laatste stand: 92,40, met een dagdaling van 9,64 punt.
■ Procentuele beweging: -9,45%.
■ Korte trend: lager en opnieuw onder de zone 100.
■ 5-daagse trend: verzwakkend na een korte opleving.
■ Maandtrend: lager dan de pieken boven 120 tot 130.
■ Duiding: vraag naar crashbescherming neemt af, geen echte trenddraai naar panic hedging.
VVIX meet de volatiliteit van de VIX zelf en geeft aan hoeveel stress er zit in de markt voor volatiliteitsbescherming. De daling van 9,45% naar 92,40 is belangrijk, omdat deze beweging laat zien dat beleggers minder agressief betalen voor bescherming tegen een nieuwe VIX-sprong. De index blijft onder 100 en ver onder de hogere stresszones die eerder zichtbaar waren.
Voor aandelen is dit een steunend signaal. Een dalende VVIX verlaagt de kans dat de markt plotseling een nieuwe volatiliteitsschok begint in te prijzen. De optiemarkt blijft alert, maar de druk vanuit crashhedges neemt af. Zolang VVIX onder 100 blijft, blijft het volatiliteitsbeeld beter beheersbaar. Een terugkeer boven 100 zou het eerste teken zijn dat de markt opnieuw defensiever wordt.
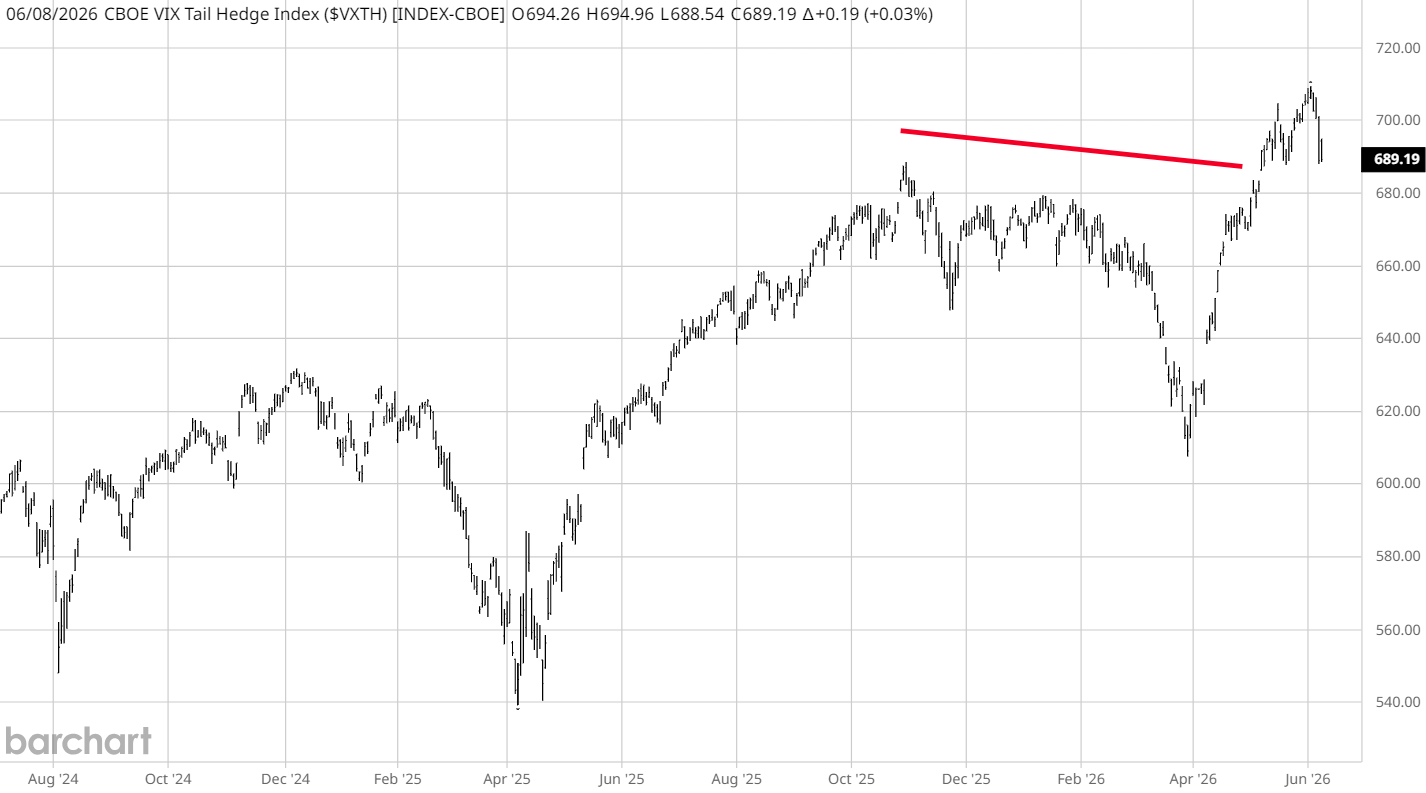
VXTH

■ Laatste stand: 689,19, met een dagstijging van 0,19 punt.
■ Procentuele beweging: +0,03%.
■ Korte trend: vrijwel vlak na een sterke stijging in de voorgaande weken.
■ 5-daagse trend: stabiliserend na de recente terugval vanaf hogere niveaus.
■ Maandtrend: hoger, maar met duidelijke afkoeling vanaf de laatste piek.
■ Duiding: tail hedge-positionering blijft aanwezig, maar versnelt niet verder.
VXTH is de CBOE VIX Tail Hedge Index en geeft een beeld van de prestatie van een strategie die aandelenblootstelling combineert met bescherming via VIX-gerelateerde tail hedges. De index stijgt slechts 0,03% naar 689,19 en beweegt daarmee vrijwel vlak. Dat is belangrijk, omdat de sterke opmars eerder aangaf dat bescherming tegen grote schokken waardevol was. Nu lijkt die beweging te stabiliseren.
De huidige stand laat zien dat tail hedges nog niet volledig worden afgebouwd, maar de versnelling is eruit. Dat past bij de bredere markt: VIX, VVIX en VXHY dalen, terwijl beleggers nog niet volledig afstand nemen van bescherming tegen extreme bewegingen. Voor beleggers betekent dit dat het verstandig blijft om risico te spreiden en niet volledig ongedekt achter de markt aan te lopen. De acute stress neemt af, maar de markt laat nog steeds zien dat bescherming waarde houdt.
VXHY

■ Laatste stand: 6,18, met een dagdaling van 0,83 punt.
■ Procentuele beweging: -11,84%.
■ Korte trend: lager na recente kredietonrust.
■ 5-daagse trend: dalend binnen een beweeglijke bandbreedte.
■ Maandtrend: duidelijk lager dan de piekzone rond 13 tot 15.
■ Duiding: kredietstress neemt af en bevestigt geen nieuwe risk-off fase.
VXHY meet volatiliteit in high yield corporate bonds en is een belangrijke barometer voor stress in risicovolle bedrijfsobligaties. De daling van 11,84% naar 6,18 is positief. Kredietvolatiliteit zakt terug en dat betekent dat high yield op dit moment geen bredere stressgolf in risk assets bevestigt.
Dit is belangrijk voor aandelen. Wanneer kredietstress oploopt, kan dat druk zetten op financieringscondities, spreads en risicobereidheid. Nu gebeurt het tegenovergestelde. VXHY blijft ver onder de eerdere pieken en beweegt binnen een lagere zone. Dat ondersteunt het idee dat de markt niet in een brede liquiditeitsstress zit. Voor cyclische aandelen, banken en small caps is dit een beter signaal dan wanneer alleen VIX zou dalen.
VXEF
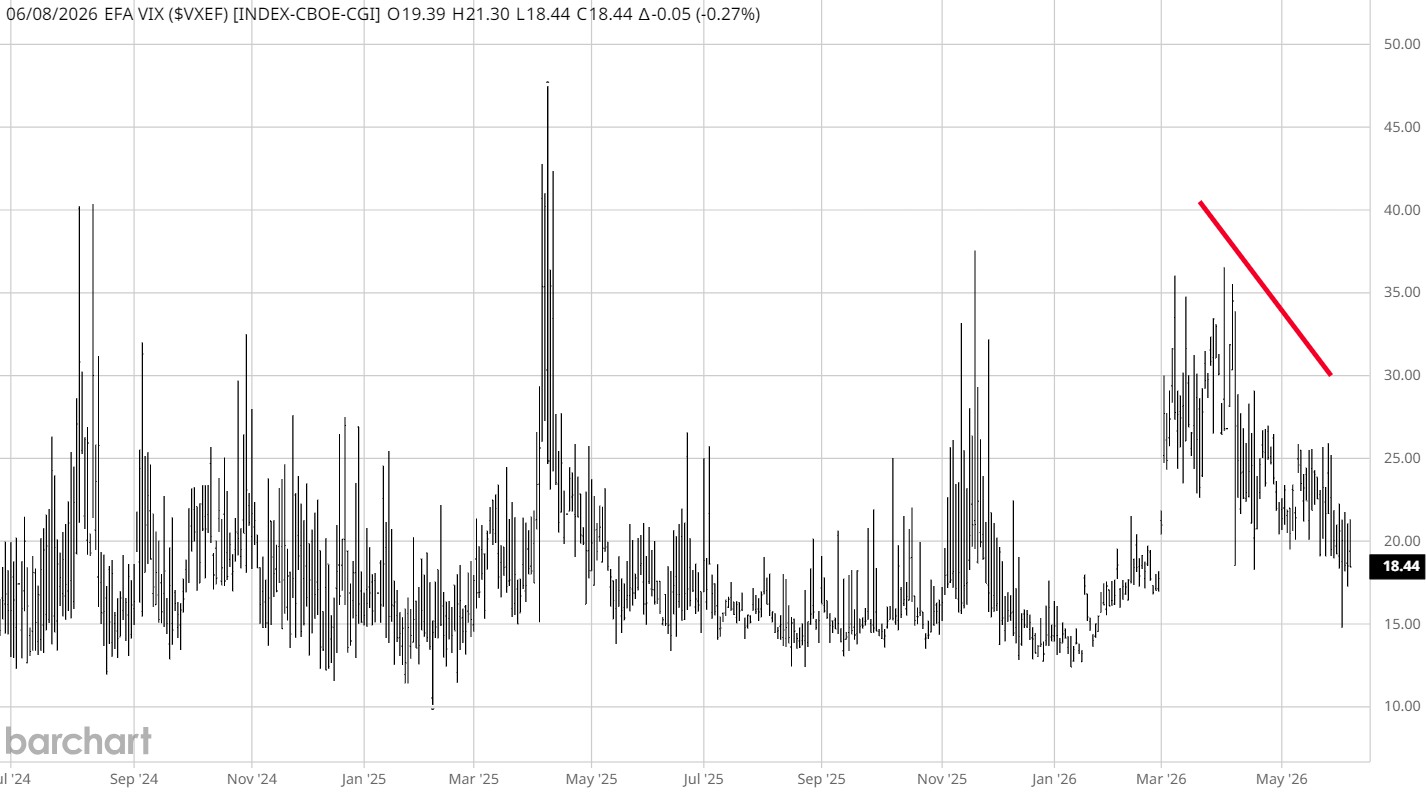
■ Laatste stand: 18,44, met een dagdaling van 0,05 punt.
■ Procentuele beweging: -0,27%.
■ Korte trend: licht lager, maar minder overtuigend dan VIX en VXST.
■ 5-daagse trend: dalend tot stabiliserend.
■ Maandtrend: lager binnen de dalende structuur vanaf de piekzone.
■ Duiding: internationale aandelenstress blijft onder controle, maar ontspant minder hard dan Amerikaanse volatiliteit.
VXEF meet de verwachte volatiliteit van EFA-gerelateerde internationale ontwikkelde markten buiten de Verenigde Staten. De daling van 0,27% naar 18,44 is beperkt, maar de index blijft wel onder de dalende trendlijn. Dat wijst op een gecontroleerd beeld voor internationale aandelenmarkten. De stress neemt niet toe en de grotere trend blijft omlaag gericht.
Toch is de beweging minder sterk dan bij VIX, VXST en VXHY. Dat betekent dat internationale markten minder overtuigend ontspannen dan de Amerikaanse volatiliteitsindices. Voor Europese en andere ontwikkelde markten is dit neutraal tot licht positief. De markt blijft koopbaar op zwakte, maar internationale risk assets moeten bevestiging geven via lagere volatiliteit en betere koersactie. Zolang VXEF onder de dalende lijn blijft, is er geen duidelijke trenddraai naar risk-off zichtbaar.
Koopkansen en positionering
De volatiliteitsstructuur ondersteunt een selectieve koopstrategie op zwakte. De belangrijkste reden is dat VIX weer onder 20 staat, VVIX onder 100 blijft en VXHY scherp terugvalt. Dat betekent dat aandelenstress, volatiliteitsstress en kredietstress niet samen omhoog bewegen. In een gezonde markt wil men juist dit zien: dalende VIX, lagere VVIX en geen bevestiging vanuit high yield-krediet.
Toch is dit geen omgeving voor blind risico kopen. VXST blijft boven VIX en dat zegt dat de markt de komende dagen nog steeds nerveuzer is dan het headline-niveau doet vermoeden. Daarom ligt de voorkeur bij sterke aandelen, kwaliteitsindices en posities met duidelijke risicogrens. Dips kunnen interessant zijn, maar alleen wanneer ze niet gepaard gaan met een nieuwe stijging in VIX boven 20, VVIX boven 100 of VXHY richting de zone 8 tot 9.
Voor positionering betekent dit: voorzichtig opbouwen, winstgevende posities beschermen en niet te agressief achter stijgingen aanlopen. De markt geeft betere signalen dan tijdens de stressfase, maar de korte termijn blijft gevoelig. De beste kansen liggen in aandelen waar de trend sterk blijft en waar lagere volatiliteit ruimte geeft voor herstel zonder dat kredietstress terugkomt.
Samenvatting
De nieuwe volatiliteitsdata zijn overwegend positief voor risk assets. VIX daalt 12,04% naar 18,92 en valt terug onder 20. VVIX daalt 9,45% naar 92,40 en bevestigt dat de vraag naar agressieve volatiliteitsbescherming afneemt. VXHY daalt 11,84% naar 6,18 en laat zien dat high yield-krediet geen nieuwe risk-off fase bevestigt. VXEF daalt licht naar 18,44 en blijft onder de dalende trendlijn, waardoor internationale aandelenstress beheersbaar blijft.
De nuance zit bij VXST en VXTH. VXST daalt hard, maar blijft met 19,69 boven VIX. Dat houdt de korte termijn beweeglijk. VXTH stijgt nauwelijks en laat zien dat tail hedge-positionering aanwezig blijft, maar niet versnelt. Het totaalbeeld is voorzichtig constructief: de markt is niet in paniek, krediet bevestigt geen escalatie en volatiliteit valt terug. Koopkansen blijven mogelijk op zwakte, maar alleen met strakke risicobewaking.
🔵 English version
Volatility drops again, but the short term remains more nervous than the headline VIX suggests
The new volatility data show a clearly calmer market picture. VIX falls 12.04% to 18.92, VVIX drops 9.45% to 92.40 and VXHY falls 11.84% to 6.18. That points to less broad stress in equities, volatility options and high yield credit. The nuance sits in VXST, because the 9-day VIX falls sharply, but remains above the regular VIX at 19.69. That means the market is still pricing more movement in the short term than the headline volatility picture alone suggests.
Investment view
■ We remain cautiously constructive on risk assets as long as VIX stays below 20 and VVIX does not break back above 100.
■ The 12.04% drop in VIX to 18.92 points to fading equity stress, but the level remains high enough to avoid calling this full calm.
■ VXST falls 17.68%, but remains above VIX at 19.69. That keeps the short term more sensitive to news, macro data and sudden intraday moves.
■ VXHY falls 11.84% to 6.18 and confirms that high yield credit is not driving a broader risk-off move at this stage.
■ VXEF falls only 0.27% to 18.44 and remains below the declining trendline. International equity stress is not rising, but the decline is less convincing than in U.S. volatility.
The overall volatility structure is therefore better than during the recent stress phase, but not fully relaxed yet. For investors, this means weakness in strong stocks can remain buyable, especially when pullbacks are not confirmed by a renewed rise in VIX, VVIX and VXHY. Still, the short end matters. VXST above VIX shows that the market continues to expect relatively elevated movement in the coming days. That fits a market where the broader trend can improve, while tactical positioning remains important.
VIX
■ Last level: 18.92, down 2.59 points on the day.
■ Percentage move: -12.04%.
■ Short-term trend: sharply lower after the recent rebound.
■ 5-day trend: moving back toward the area below 20.
■ Monthly trend: lower within the declining structure from the prior peak.
■ Interpretation: fading stress, no confirmation of a broad trend reversal into panic.
The VIX measures expected volatility on the S&P 500 and remains the main gauge of U.S. equity stress. The 12.04% decline to 18.92 is a strong signal. The market is pricing less protection and has moved back below the important 20 level. That is positive for equities, because much of the systematic and options-related pressure tends to increase when VIX stays structurally above 20.
The move fits the declining trend on the chart. The earlier rise toward higher levels did not continue and the index remains well below the peak zone of recent months. Still, 18.92 is not an extremely low level. The market is calmer, but not fully relaxed. For equities, this means dips can be absorbed more easily, while fast moves remain possible if macro data, rates or geopolitics create renewed pressure.
VXST
■ Last level: 19.69, down 4.23 points on the day.
■ Percentage move: -17.68%.
■ Short-term trend: sharply lower after a recent short-term stress spike.
■ 5-day trend: still volatile, with support above the calmer 10 to 14 zone.
■ Monthly trend: lower than the earlier peak, but not back to full calm.
■ Interpretation: short-term stress is easing, but remains higher than the regular VIX.
VXST measures 9-day expected volatility on the S&P 500 and is therefore more sensitive to immediate market stress than the regular VIX. The 17.68% decline to 19.69 is powerful and shows that the immediate panic is leaving the market. Still, VXST remains above the regular VIX. That matters, because the market is still pricing more movement for the coming days than for the broader 30-day volatility window.
This is not bearish by itself, but it is a short-term warning. Investors should expect more intraday volatility, especially around macro data, rate expectations and major index levels. For traders, this means buying opportunities on weakness can remain attractive, but positions need to be managed tightly. The market is calmer, but not fully stable yet.
VVIX
■ Last level: 92.40, down 9.64 points on the day.
■ Percentage move: -9.45%.
■ Short-term trend: lower and back below the 100 area.
■ 5-day trend: weakening after a brief rebound.
■ Monthly trend: lower than the peaks above 120 to 130.
■ Interpretation: demand for crash protection is fading, with no real trend reversal into panic hedging.
VVIX measures the volatility of the VIX itself and shows how much stress exists in the market for volatility protection. The 9.45% decline to 92.40 is important, because it shows that investors are less willing to pay aggressively for protection against another VIX spike. The index remains below 100 and far below the higher stress zones seen earlier.
For equities, this is supportive. A falling VVIX reduces the probability that the market suddenly starts pricing a new volatility shock. The options market remains alert, but pressure from crash hedges is easing. As long as VVIX stays below 100, the volatility picture remains more manageable. A return above 100 would be the first sign that the market is turning defensive again.
VXTH
■ Last level: 689.19, up 0.19 point on the day.
■ Percentage move: +0.03%.
■ Short-term trend: almost flat after a strong rise in prior weeks.
■ 5-day trend: stabilizing after the recent pullback from higher levels.
■ Monthly trend: higher, but with clear cooling from the latest peak.
■ Interpretation: tail hedge positioning remains present, but is no longer accelerating.
VXTH is the CBOE VIX Tail Hedge Index and provides a view of the performance of a strategy that combines equity exposure with protection through VIX-related tail hedges. The index rises only 0.03% to 689.19 and is therefore nearly flat. That matters, because the earlier strong advance showed that protection against large shocks had value. Now that move appears to be stabilizing.
The current level shows that tail hedges are not being fully abandoned, but the acceleration has faded. That fits the broader market: VIX, VVIX and VXHY are falling, while investors are not fully walking away from protection against extreme moves. For investors, this means risk should still be diversified and equity exposure should not be chased without protection. Acute stress is fading, but the market still shows that protection has value.
VXHY
■ Last level: 6.18, down 0.83 point on the day.
■ Percentage move: -11.84%.
■ Short-term trend: lower after recent credit volatility.
■ 5-day trend: declining within a volatile range.
■ Monthly trend: clearly below the peak zone around 13 to 15.
■ Interpretation: credit stress is easing and does not confirm a new risk-off phase.
VXHY measures volatility in high yield corporate bonds and is an important barometer for stress in risky corporate credit. The 11.84% decline to 6.18 is positive. Credit volatility is falling back, which means high yield is currently not confirming a broader stress wave in risk assets.
This matters for equities. When credit stress rises, it can pressure financing conditions, spreads and risk appetite. Now the opposite is happening. VXHY remains far below the earlier peaks and is moving within a lower zone. That supports the view that the market is not in broad liquidity stress. For cyclical stocks, banks and small caps, this is a better signal than a decline in VIX alone.
VXEF
■ Last level: 18.44, down 0.05 point on the day.
■ Percentage move: -0.27%.
■ Short-term trend: slightly lower, but less convincing than VIX and VXST.
■ 5-day trend: declining to stabilizing.
■ Monthly trend: lower within the declining structure from the peak zone.
■ Interpretation: international equity stress remains controlled, but is easing less aggressively than U.S. volatility.
VXEF measures expected volatility in EFA-related developed international markets outside the United States. The 0.27% decline to 18.44 is limited, but the index remains below the declining trendline. That points to a controlled picture for international equity markets. Stress is not rising and the broader trend remains lower.
Still, the move is less powerful than in VIX, VXST and VXHY. That means international markets are easing less convincingly than U.S. volatility indices. For European and other developed markets, this is neutral to slightly positive. The market remains buyable on weakness, but international risk assets need confirmation through lower volatility and better price action. As long as VXEF remains below the declining line, there is no clear trend reversal into risk-off.
Buying opportunities and positioning
The volatility structure supports a selective buy-the-dip strategy. The key reason is that VIX is back below 20, VVIX remains below 100 and VXHY is falling sharply. That means equity stress, volatility stress and credit stress are not rising together. In a healthy market, this is exactly what investors want to see: falling VIX, lower VVIX and no confirmation from high yield credit.
Still, this is not an environment for blindly buying risk. VXST remains above VIX and that says the market is more nervous in the coming days than the headline level suggests. Therefore the preference is for strong stocks, quality indices and positions with a clear risk line. Dips can be interesting, but only when they are not accompanied by a renewed rise in VIX above 20, VVIX above 100 or VXHY toward the 8 to 9 area.
For positioning, this means building exposure carefully, protecting profitable positions and not chasing rallies too aggressively. The market gives better signals than during the stress phase, but the short term remains sensitive. The best opportunities are in stocks where the trend remains strong and where lower volatility creates room for recovery without a return of credit stress.
Summary
The new volatility data are broadly positive for risk assets. VIX falls 12.04% to 18.92 and moves back below 20. VVIX falls 9.45% to 92.40 and confirms that demand for aggressive volatility protection is easing. VXHY falls 11.84% to 6.18 and shows that high yield credit is not confirming a new risk-off phase. VXEF declines slightly to 18.44 and remains below the declining trendline, keeping international equity stress manageable.
The nuance sits in VXST and VXTH. VXST falls sharply, but remains above VIX at 19.69. That keeps the short term volatile. VXTH rises only marginally and shows that tail hedge positioning remains present, but is not accelerating. The overall picture is cautiously constructive: the market is not in panic, credit is not confirming escalation and volatility is falling back. Buying opportunities remain possible on weakness, but only with tight risk control.
Disclaimer Aan de door ons opgestelde informatie kan op geen enkele wijze rechten worden ontleend. Alle door ons verstrekte informatie en analyses zijn geheel vrijblijvend. Alle consequenties van het op welke wijze dan ook toepassen van de informatie blijven volledig voor uw eigen rekening.
Wij aanvaarden geen aansprakelijkheid voor de mogelijke gevolgen of schade die zouden kunnen voortvloeien uit het gebruik van de door ons gepubliceerde informatie. U bent zelf eindverantwoordelijk voor de beslissingen die u neemt met betrekking tot uw beleggingen.


