✖️ Heijmans en de VWAP: Aan het dalen vanaf de top - Wat zegt de chart
Heijmans heeft een fenomenale run achter de rug. We zijn in 2023 vroeg ingestapt, hebben vrijwel de hele beweging naar boven meegemaakt en hebben inmiddels al enige tijd geen positie meer. Nu de koers is teruggevallen vanaf de top net onder 120 euro, kijken we opnieuw naar de chart en vooral naar de VWAP-lijnen.
Wil je alle artikelen kunnen lezen en elke podcast beluisteren? Neem dan een abonnement en krijg toegang tot alle artikelen en de database met duizenden berichten.
■ Heijmans is fors teruggevallen na een uitzonderlijke stijging sinds 2023.
■ De VWAP-lijnen vanaf april 2025 geven nu aan waar de markt gemiddeld positie heeft opgebouwd.
■ De lichtblauwe upper band 1 werkte tijdens de stijging als dynamische bovenkant van het trendkanaal.
■ De witte VWAP is de eerste echte evenwichtslijn waar een correctie technisch rust kan vinden.
■ Voor ons ontstaat pas tussen 66 en 75 euro opnieuw een betere verhouding tussen risico en herstelpotentieel.
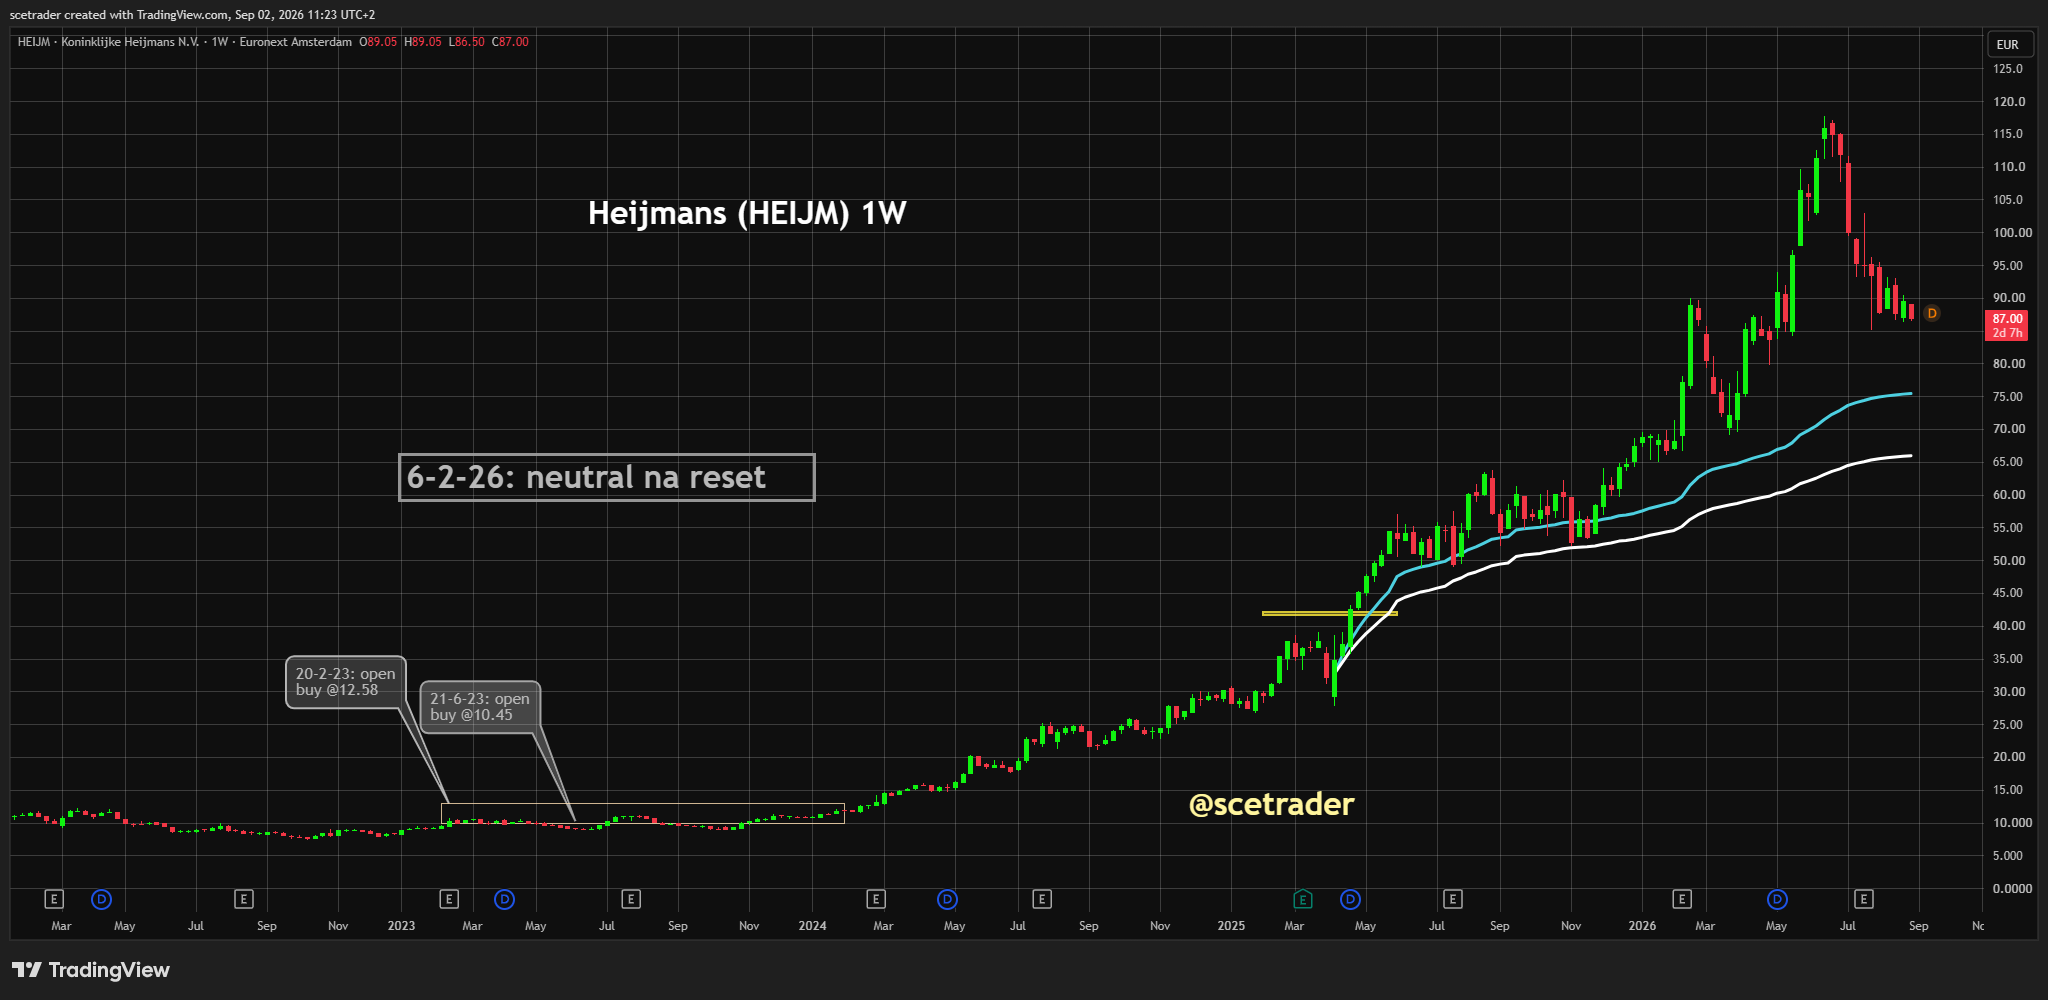
De chart laat zien hoe krachtig Heijmans sinds 2023 is geweest. Het aandeel liep hard op en bereikte uiteindelijk een top net onder 120 euro. Vanaf dat niveau is de koers gaan corrigeren. Dat is op zichzelf logisch, omdat een aandeel na zo’n sterke beweging vaak terugvalt naar zones waar eerder veel volume is verhandeld.
Daarom kijken we nu naar de Volume Weighted Average Price-lijnen vanaf april 2025. De witte lijn is de gewone VWAP. Die lijn laat zien tegen welke gemiddelde prijs beleggers sinds dat moment, gewogen naar volume, positie hebben opgebouwd. Komt de koers terug richting die lijn, dan wordt duidelijk of kopers bereid zijn opnieuw in te stappen.
De lichtblauwe lijn is de upper band 1. Tijdens de stijging bewoog Heijmans vaak langs deze lijn omhoog. Dat betekent dat het aandeel bovenmatig sterk lag. Nu de koers daaronder is teruggevallen, is het extreme momentum eruit. Dat maakt de chart niet meteen slecht, maar wel minder aantrekkelijk dan tijdens de opgaande fase.
De zone tussen 66 en 75 euro is daarom technisch belangrijk. Rond 75 euro komt de koers dichter bij het gebied waar de eerdere stijging normaliseert. Rond 66 euro ligt de aantrekkelijkere kant van de correctie, omdat daar meer ruimte ontstaat voor een nieuwe bodem en een betere risk-reward. In die bandbreedte kan de markt opnieuw bepalen of Heijmans steun vindt.
Een snelle rebound vanaf de huidige niveaus kan natuurlijk altijd, maar dan zouden wij eerst willen zien dat de koers weer hogere bodems maakt en opnieuw boven de kortere VWAP-structuur komt. Zonder dat signaal blijft een herstel vooral kwetsbaar.
Voor een nieuwe positie wachten wij daarom liever op 66 tot 75 euro. Daar wordt de chart concreter: houdt de koers daar stand, dan kan een nieuwe technische koopzone ontstaan. Breekt ook die zone overtuigend, dan is het risico groter dat de correctie dieper wordt en dat geduld opnieuw nodig is.
English version
Heijmans: after the peak, the VWAP zone defines where the stock becomes interesting again
Heijmans has had a phenomenal run. We entered the stock early in 2023, captured almost the entire move higher and have had no position for some time now. With the price pulling back from its peak just below 120 euros, we are looking again at the chart and especially at the VWAP lines.
■ Heijmans has fallen sharply after an exceptional rise since 2023.
■ The VWAP lines from April 2025 now show where the market has built positions on a volume-weighted basis.
■ The light blue upper band 1 acted as the dynamic upper side of the trend channel during the rally.
■ The white VWAP is the first real equilibrium line where a correction can technically find support.
■ For us, a better balance between risk and recovery potential only appears between 66 and 75 euros.
The chart shows how powerful Heijmans has been since 2023. The stock rose sharply and eventually reached a peak just below 120 euros. From that level, the price started to correct. That is logical, because after such a strong move, a stock often falls back toward areas where a lot of volume was previously traded.
That is why we are now looking at the Volume Weighted Average Price lines from April 2025. The white line is the regular VWAP. It shows the average price at which investors have built positions since that moment, weighted by volume. If the stock moves back toward that line, the key question is whether buyers are willing to step in again.
The light blue line is upper band 1. During the rally, Heijmans often moved higher along this line. That means the stock was trading with exceptional strength. Now that the price has fallen below it, the extreme momentum has faded. That does not make the chart immediately weak, but it does make it less attractive than during the upward phase.
The 66 to 75 euro zone is therefore technically important. Around 75 euros, the stock moves closer to the area where the previous rally starts to normalize. Around 66 euros, the correction becomes more attractive, because there is more room for a new bottom and a better risk-reward. Within this range, the market can determine whether Heijmans finds support again.
A quick rebound from current levels is always possible, but in that case we would first want to see higher lows and a move back above the shorter VWAP structure. Without that signal, any recovery remains vulnerable.
For a new position, we would therefore rather wait for 66 to 75 euros. That is where the chart becomes more concrete: if the stock holds there, a new technical buying zone can develop. If that zone also breaks convincingly, the risk increases that the correction becomes deeper and that patience is needed again.
Disclaimer Aan de door ons opgestelde informatie kan op geen enkele wijze rechten worden ontleend. Alle door ons verstrekte informatie en analyses zijn geheel vrijblijvend. Alle consequenties van het op welke wijze dan ook toepassen van de informatie blijven volledig voor uw eigen rekening.
Wij aanvaarden geen aansprakelijkheid voor de mogelijke gevolgen of schade die zouden kunnen voortvloeien uit het gebruik van de door ons gepubliceerde informatie. U bent zelf eindverantwoordelijk voor de beslissingen die u neemt met betrekking tot uw beleggingen.


