🏌️Applied Optoelectronics: sterke optiecurve met verdere versnelling langere horizon
Wil je alle artikelen kunnen lezen en elke podcast beluisteren? Neem dan een abonnement en krijg toegang tot alle artikelen en de database met duizenden berichten.
We zijn momenteel in bèta bezig met een model waarmee we aan de hand van opties proberen te berekenen waar de koers van een aandeel theoretisch naartoe zou kunnen bewegen. Het model gebruikt informatie uit verschillende looptijden in de optiemarkt en vertaalt die naar mogelijke koersniveaus voor de komende maanden en jaren.
Heb je vragen stuur gerust een appje, of naar info@scetrader.nl een mail.
Laten we verder gaan
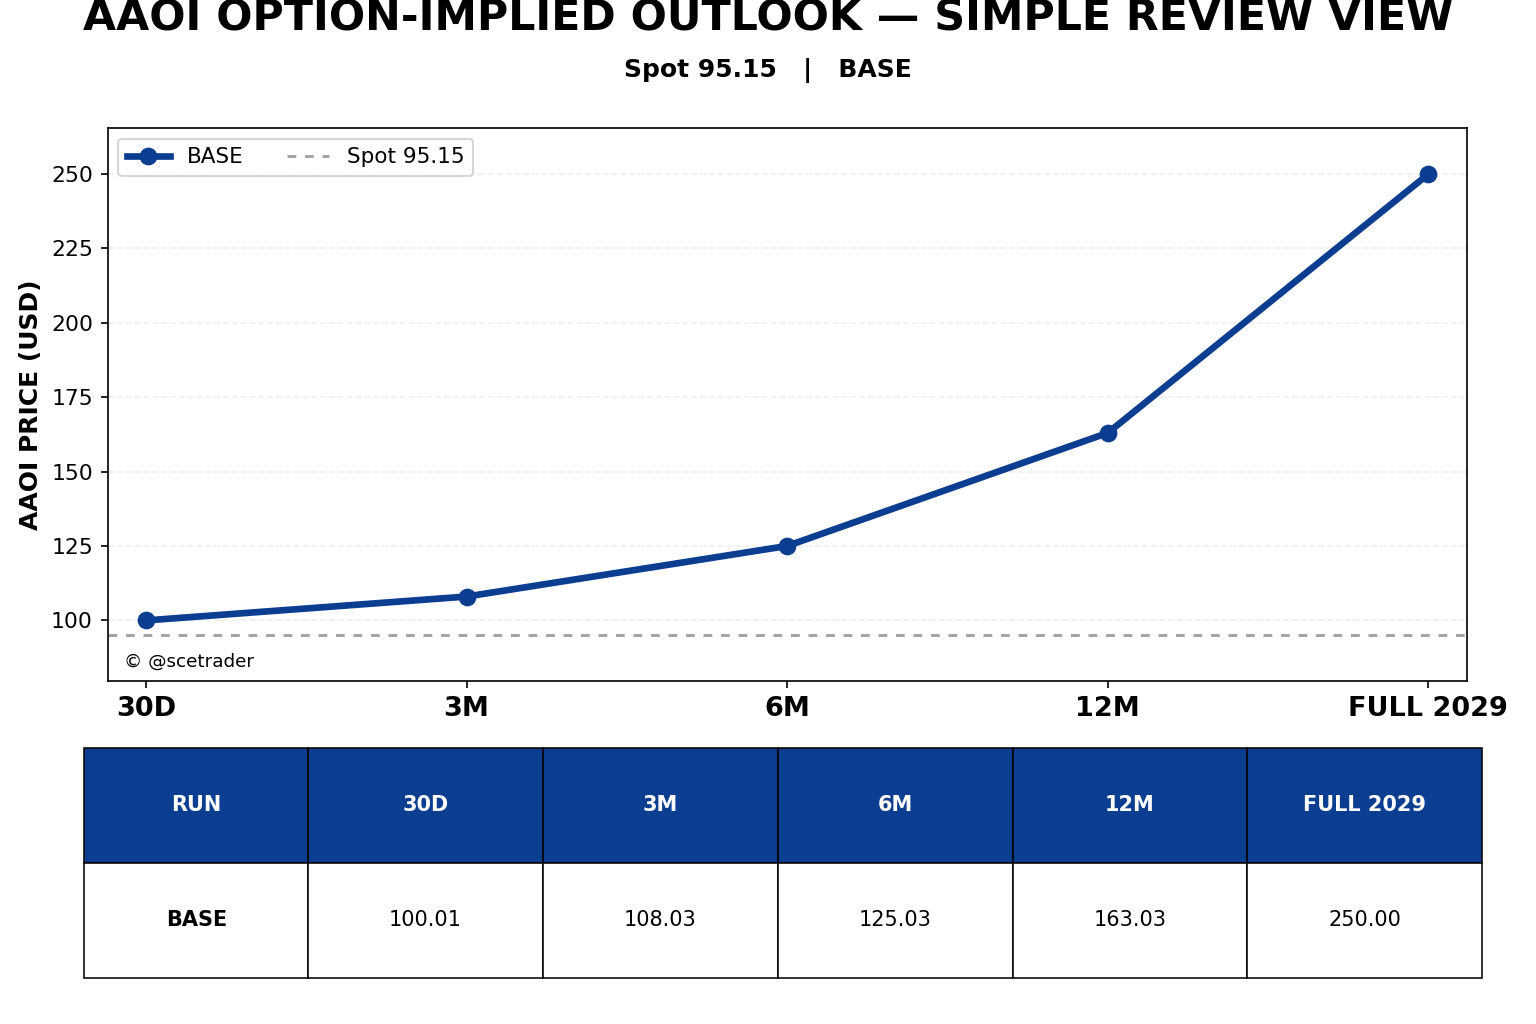
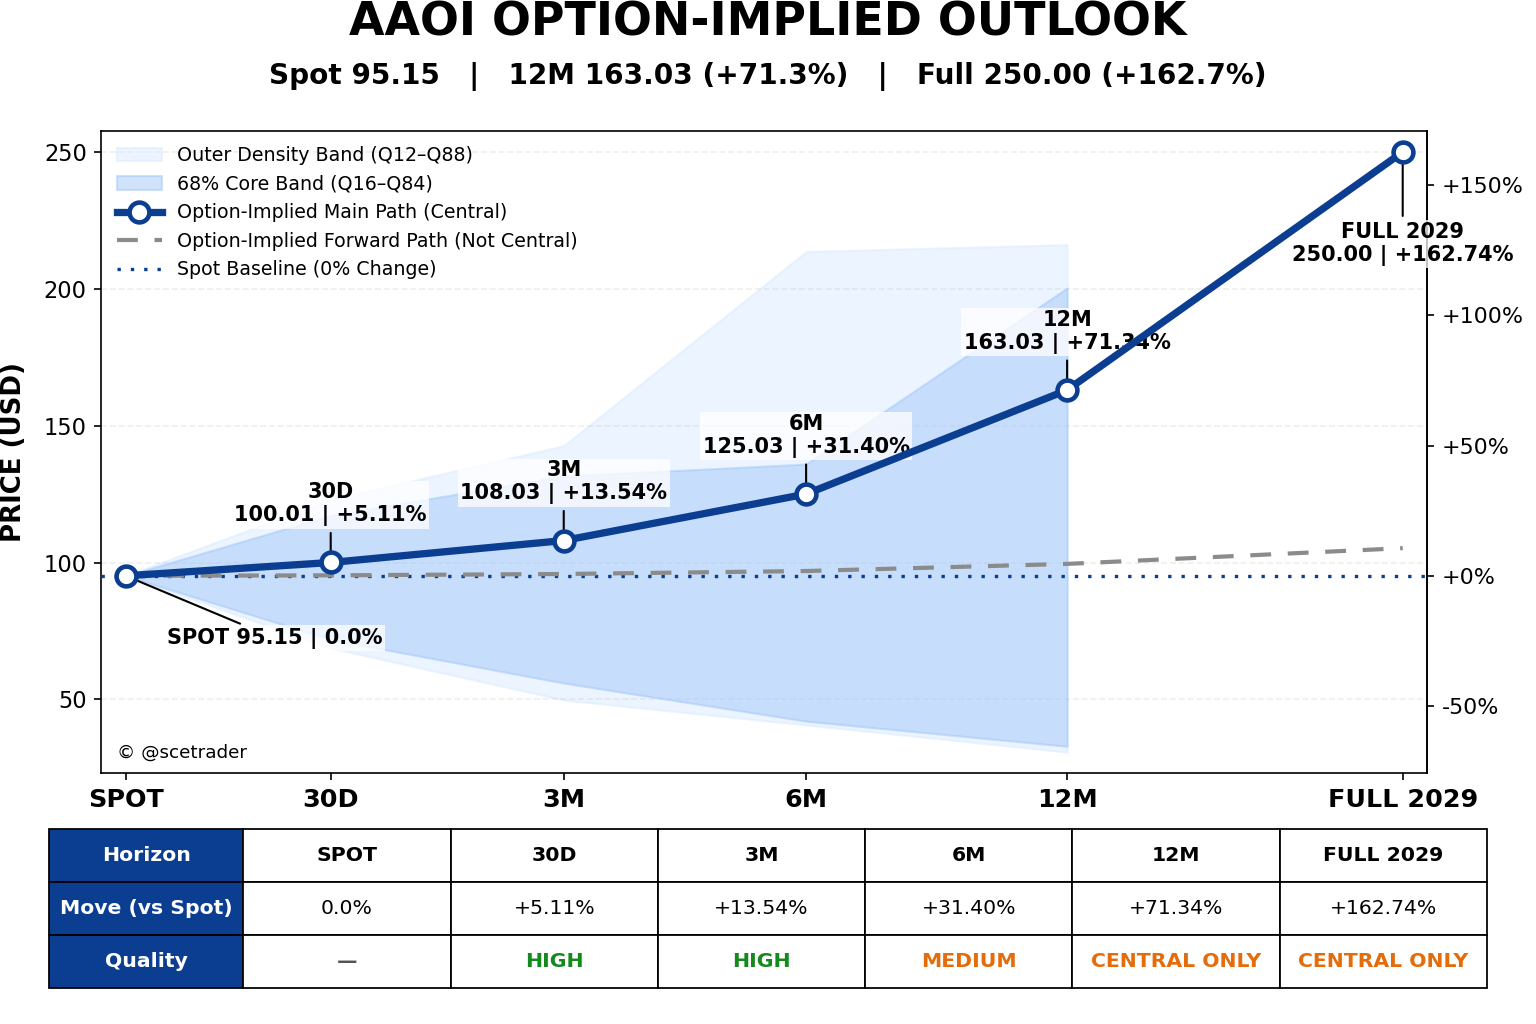
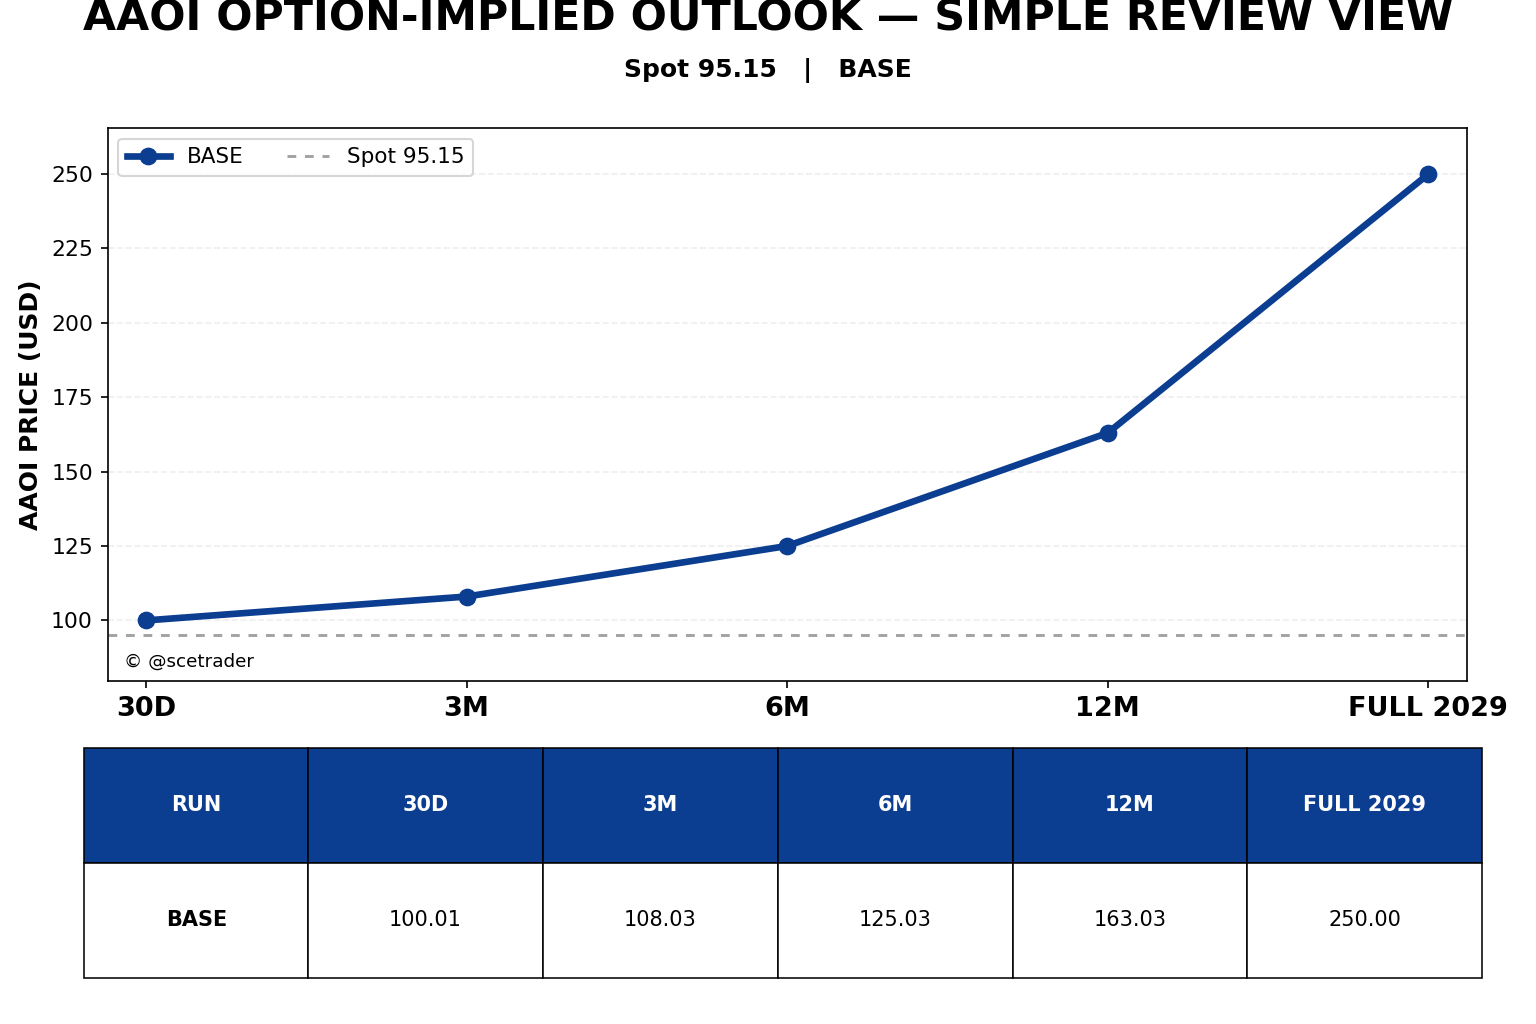
Applied Optoelectronics noteert in deze berekening op 95,15 dollar. De optiecurve blijft over alle vijf horizons positief. Het centrale pad loopt van 100,01 dollar op 30 dagen naar 108,03 dollar op drie maanden, 125,03 dollar op zes maanden, 163,03 dollar op twaalf maanden en 250,00 dollar voor FULL 2029.
De niveaus zijn modeluitkomsten en scenario-uitkomsten uit de aangeleverde optieketen en geen officiële koersdoelen. De zeer hoge implied volatility betekent dat de werkelijke koersbewegingen aanzienlijk groter kunnen zijn dan het centrale pad suggereert.
Algemeen beeld
De ATM IV ligt over vrijwel de hele curve rond 85% tot 94%. AAOI blijft daarmee een uitgesproken hoge-volatiliteitscase.
De directionele tilt is op 30D, 3M en 6M sterk positief en blijft ook rond twaalf maanden overtuigend positief. Aan de langste kant neemt de directionele kracht af, maar de callstructuur blijft voldoende sterk om een hoger centraal pad dan de terminale Own Main te ondersteunen.
Overzicht
| Horizon | Main path | Vanaf spot | Expiry / referentie | Quality |
|---|---|---|---|---|
| 30D | 100,01 | +5,11% | 30 oktober 2026 | HIGH |
| 3M | 108,03 | +13,54% | 18 december 2026 | HIGH |
| 6M | 125,03 | +31,40% | 19 maart 2027 | MEDIUM |
| 12M | 163,03 | +71,34% | 28 september 2027 | CENTRAL ONLY |
| FULL 2029 | 250,00 | +162,69% | long-end review | CENTRAL ONLY |
30 dagen: stevige positieve start
Het centrale niveau ligt op 100,01 dollar, 5,11% boven de huidige koers van 95,15 dollar.
De Forward ligt op 95,31 en de ATM IV rond 85,0%. De directionele tilt is 0,847 en daarmee sterk positief.
De bandvalidatie is positief en de quality is HIGH.
3 maanden: duidelijke stijging
Het centrale niveau ligt op 108,03 dollar, 13,54% boven spot.
Ten opzichte van 30D stijgt het centrale pad met 8,02 dollar.
De Forward ligt op 95,81 en de ATM IV rond 92,2%. De directionele tilt is 0,762 en daarmee sterk positief.
De bandvalidatie is positief en de quality is HIGH.
6 maanden: sterke opwaartse sprong
Het centrale niveau ligt op 125,03 dollar, 31,40% boven spot.
Ten opzichte van 3M stijgt het centrale pad met 16,99 dollar. De curve versnelt daarmee duidelijk.
De Forward ligt op 96,89 en de ATM IV rond 93,4%. De directionele tilt is 0,754 en blijft sterk positief.
De bandvalidatie is positief en de quality is MEDIUM.
12 maanden: zeer sterke versnelling
Het centrale niveau ligt op 163,03 dollar, 71,34% boven de huidige koers.
Ten opzichte van 6M stijgt het centrale pad met 38,01 dollar.
De twaalfmaandszone wordt gedragen door de maturity-ladder tussen de echte 262- en 480-dagenexpiries. De eigen Main loopt daar van 143,07 naar 185,32 dollar.
De Forward ligt rond 99,50 en de ATM IV rond 93,4%. De directionele tilt ligt rond 0,706 en blijft daarmee sterk positief.
De quality is CENTRAL ONLY, waardoor de onzekerheidsband groot blijft.
Langste looptijd: verdere versnelling naar 250 dollar
FULL 2029 ligt op 250,00 dollar, 162,69% boven de huidige koers.
Ten opzichte van 12M stijgt het centrale pad met 86,97 dollar.
De terminale januari-2029 expiry geeft zelf een Main van 202,96 dollar, terwijl de ruwe maturity-regimeprojectie op 367,68 dollar uitkomt.
De terminale chain is aan de bovenkant afgeknot en mist een volledige hogere call-wing. Daarom wordt 250 dollar als centrale long-end uitkomst gebruikt: duidelijk hoger dan de eigen terminale Main, maar nog ver onder de extreme regimeprojectie.
De terminale Forward ligt op 105,25 en de ATM IV rond 92,6%. De directionele tilt is 0,408 en blijft positief. De quality is CENTRAL ONLY.
Het volledige koerspad
De volledige curve luidt:
100,01 → 108,03 → 125,03 → 163,03 → 250,00.
Of procentueel vanaf spot:
+5,11% → +13,54% → +31,40% → +71,34% → +162,69%.
De onderliggende maturity-ladder blijft grilliger dan deze vijf centrale punten. Na een sterke opbouw richting 185 dollar volgt tijdelijk een terugval richting 170 dollar, waarna de lange richting opnieuw aantrekt.
Het totaalbeeld blijft daarmee zeer bullish: sterke korte bevestiging, forse versnelling vanaf zes maanden en uiteindelijk een FULL-scenario dat ruim tweeënhalf keer de huidige koers vertegenwoordigt.
English
Applied Optoelectronics: strong options curve with further acceleration at the long end
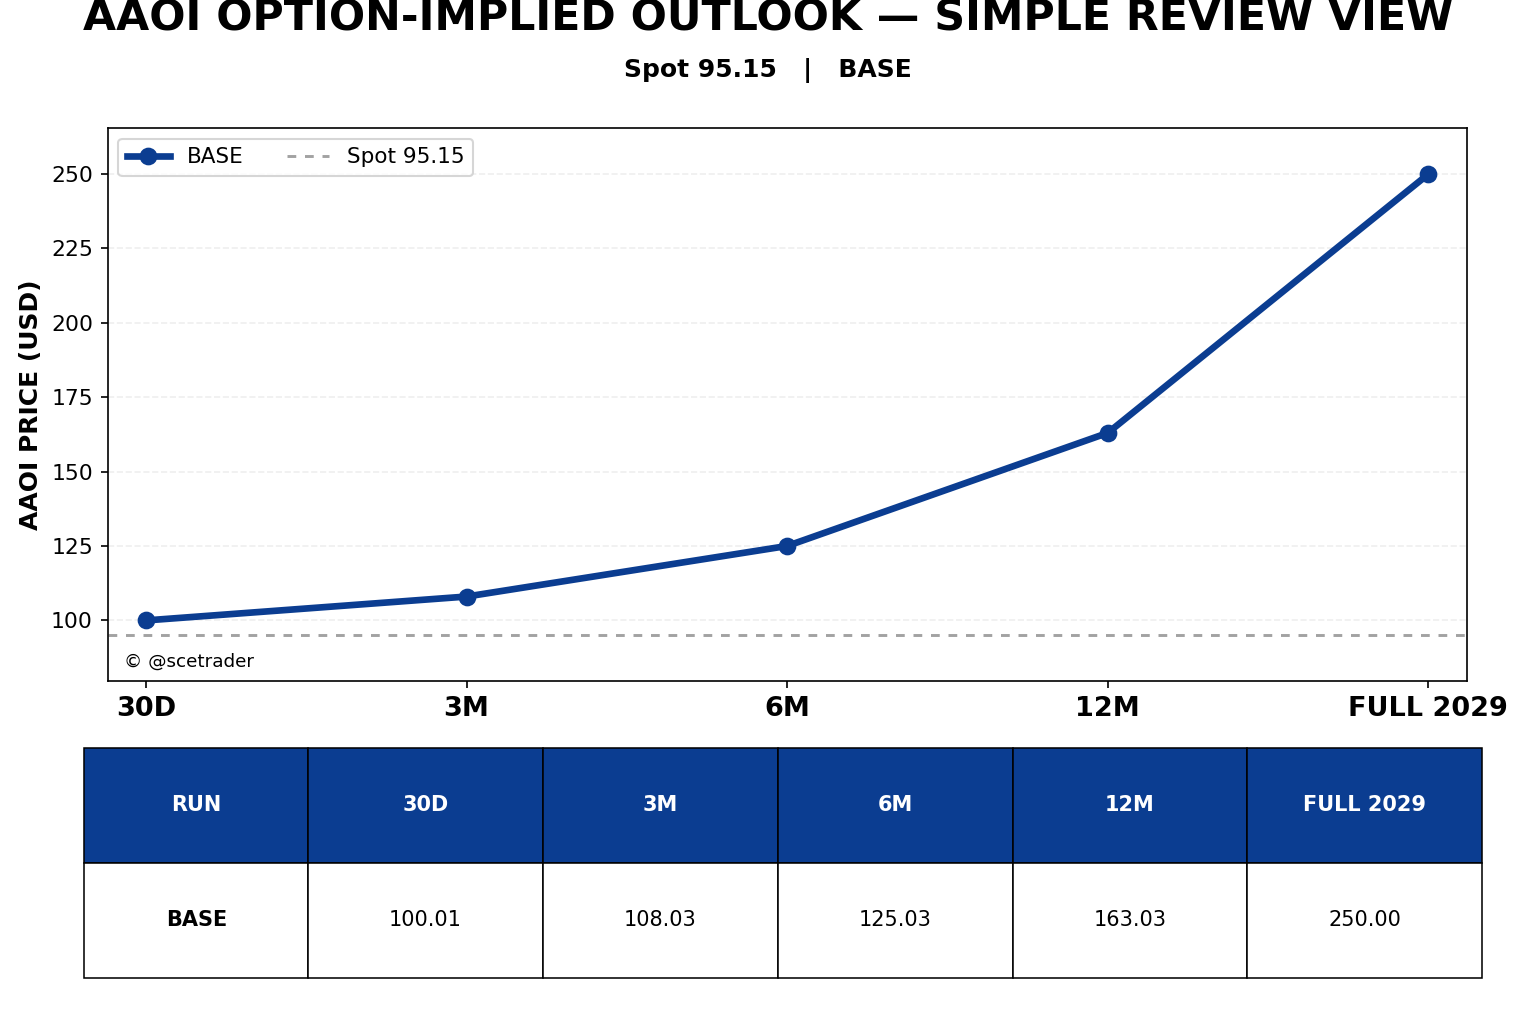
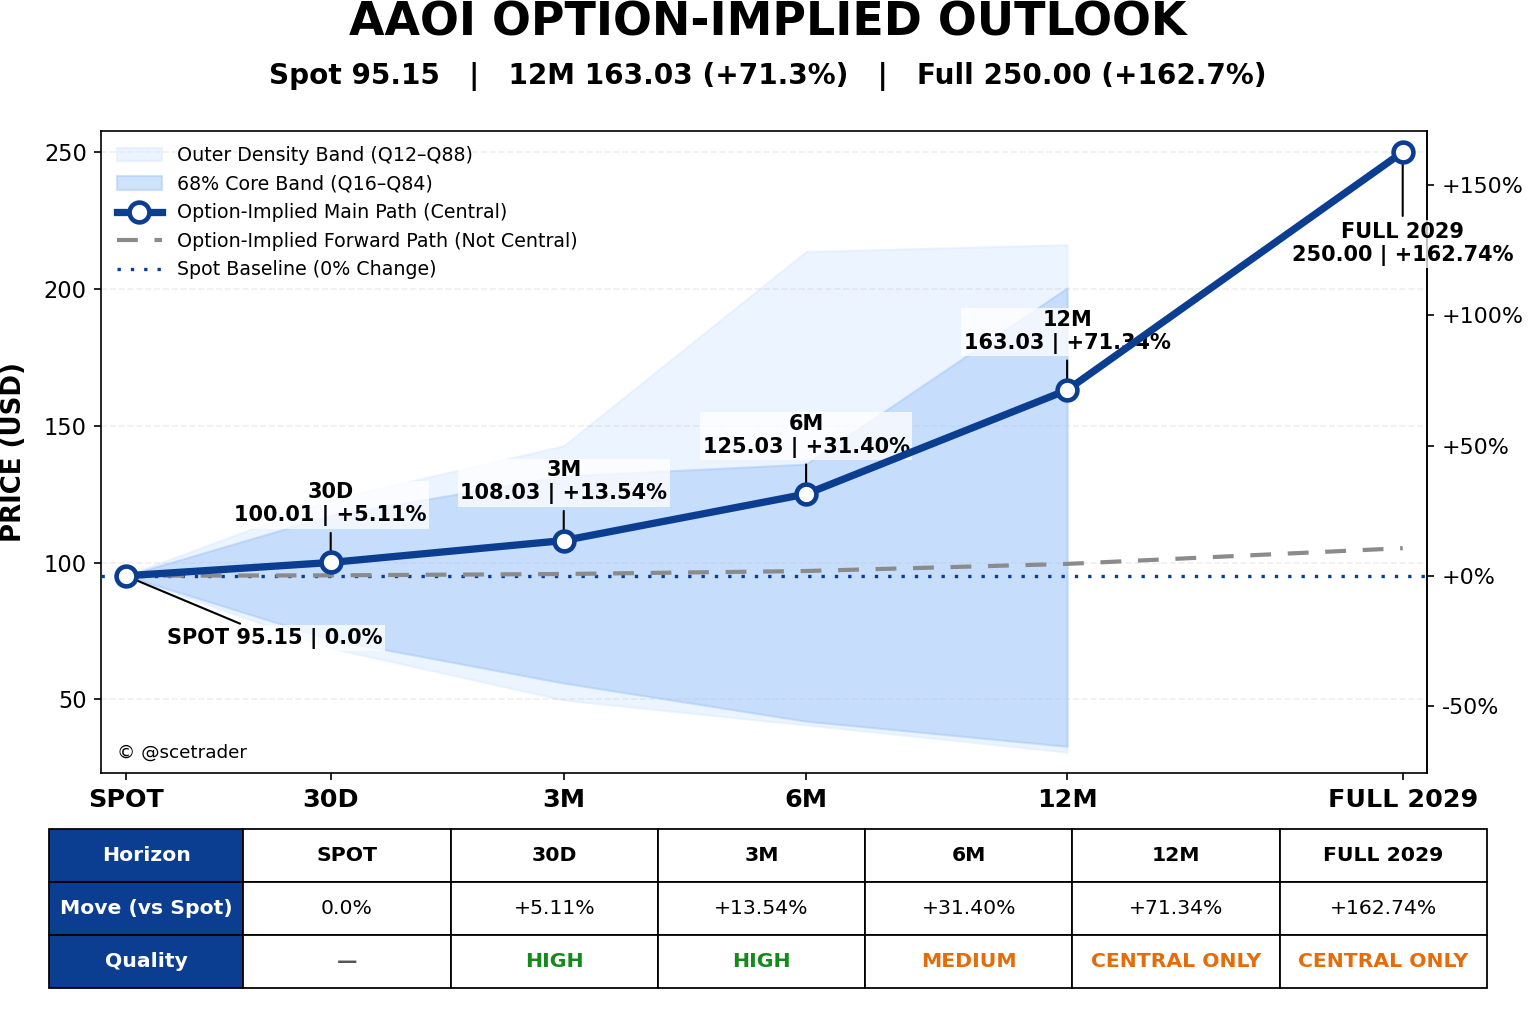
Applied Optoelectronics starts from a reference price of $95.15. The options curve remains positive across all five horizons. The central path rises from $100.01 at 30 days to $108.03 at three months, $125.03 at six months, $163.03 at twelve months and $250.00 for FULL 2029.
These levels are model and scenario outputs from the supplied options chain and are not official price targets. Very high implied volatility means actual price movements can be substantially larger than the central path suggests.
General view
ATM IV remains roughly between 85% and 94% across most of the curve. AAOI therefore remains a pronounced high-volatility case.
Directional tilt is strongly positive at 30D, 3M and 6M and remains convincingly positive around twelve months. Directional strength declines at the longest maturity, but the call structure remains strong enough to support a materially higher central path than the terminal Own Main alone.
Overview
| Horizon | Main path | From spot | Expiry / reference | Quality |
|---|---|---|---|---|
| 30D | $100.01 | +5.11% | October 30, 2026 | HIGH |
| 3M | $108.03 | +13.54% | December 18, 2026 | HIGH |
| 6M | $125.03 | +31.40% | March 19, 2027 | MEDIUM |
| 12M | $163.03 | +71.34% | September 28, 2027 | CENTRAL ONLY |
| FULL 2029 | $250.00 | +162.69% | long-end review | CENTRAL ONLY |
30 days: strong positive start
The central level is $100.01, 5.11% above the current share price of $95.15.
The Forward is $95.31 and ATM IV is around 85.0%. Directional tilt is 0.847, which is strongly positive.
Band validation is positive and quality is HIGH.
3 months: clear rise
The central level is $108.03, 13.54% above spot.
Compared with 30D, the central path rises by $8.02.
The Forward is $95.81 and ATM IV is around 92.2%. Directional tilt is 0.762, which is strongly positive.
Band validation is positive and quality is HIGH.
6 months: strong upward jump
The central level is $125.03, 31.40% above spot.
Compared with 3M, the central path rises by $16.99. The curve therefore clearly accelerates.
The Forward is $96.89 and ATM IV is around 93.4%. Directional tilt is 0.754 and remains strongly positive.
Band validation is positive and quality is MEDIUM.
12 months: very strong acceleration
The central level is $163.03, 71.34% above the current share price.
Compared with 6M, the central path rises by $38.01.
The twelve-month area is supported by the maturity ladder between the real 262- and 480-day expiries. Own Main rises there from $143.07 to $185.32.
The Forward is around $99.50 and ATM IV around 93.4%. Directional tilt is around 0.706 and therefore remains strongly positive.
Quality is CENTRAL ONLY, so uncertainty remains substantial.
Longest maturity: further acceleration toward $250
FULL 2029 is set at $250.00, 162.69% above the current share price.
Compared with 12M, the central path rises by $86.97.
The terminal January 2029 expiry itself produces a Main of $202.96, while the raw maturity-regime projection reaches $367.68.
The terminal chain is truncated on the upside and does not capture a complete higher call wing. $250 is therefore used as the central long-end outcome: materially above the terminal Own Main, but still far below the extreme regime projection.
The terminal Forward is $105.25 and ATM IV around 92.6%. Directional tilt is 0.408 and remains positive. Quality is CENTRAL ONLY.
The full price path
The complete curve is:
$100.01 → $108.03 → $125.03 → $163.03 → $250.00.
From spot, that equals:
+5.11% → +13.54% → +31.40% → +71.34% → +162.69%.
The underlying maturity ladder is more irregular than these five central points. After a strong build toward roughly $185, it temporarily pulls back toward $170 before the long-term direction strengthens again.
The overall picture therefore remains highly bullish: strong short-term confirmation, major acceleration from six months onward and ultimately a FULL scenario at more than two and a half times the current share price.
Disclaimer Aan de door ons opgestelde informatie kan op geen enkele wijze rechten worden ontleend. Alle door ons verstrekte informatie en analyses zijn geheel vrijblijvend. Alle consequenties van het op welke wijze dan ook toepassen van de informatie blijven volledig voor uw eigen rekening.
Wij aanvaarden geen aansprakelijkheid voor de mogelijke gevolgen of schade die zouden kunnen voortvloeien uit het gebruik van de door ons gepubliceerde informatie. U bent zelf eindverantwoordelijk voor de beslissingen die u neemt met betrekking tot uw beleggingen.


