🏌️ AMD: Optiecurve loopt op en versnelt sterk aan de lange kant
Wil je alle artikelen kunnen lezen en elke podcast beluisteren? Neem dan een abonnement en krijg toegang tot alle artikelen en de database met duizenden berichten.
We zijn momenteel in bèta bezig met een model waarmee we aan de hand van opties proberen te berekenen waar de koers van een aandeel theoretisch naartoe zou kunnen bewegen. Het model gebruikt informatie uit verschillende looptijden in de optiemarkt en vertaalt die naar mogelijke koersniveaus voor de komende maanden en jaren.
Heb je vragen stuur gerust een appje, of naar info@scetrader.nl een mail.
Advanced Micro Devices
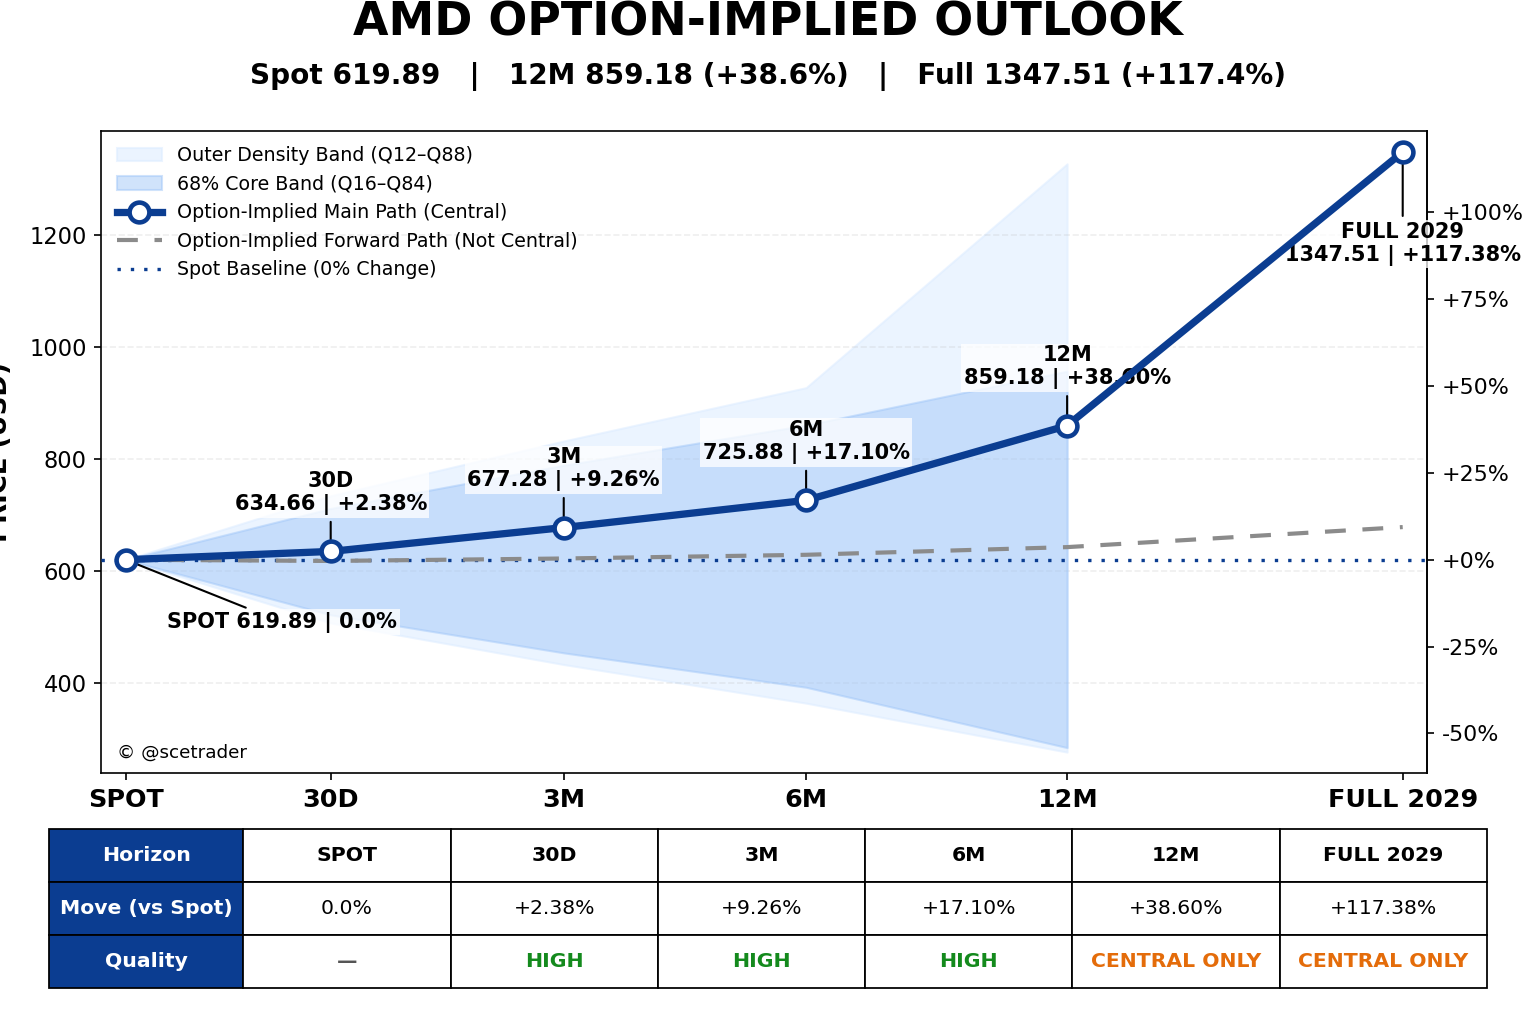
Advanced Micro Devices noteert in deze berekening op 619,89 dollar. 30D→3M: duidelijke stijging; 3M→6M: duidelijke stijging; 6M→12M: sterke opwaartse sprong; 12M→FULL 2029: sterke opwaartse sprong.
De niveaus zijn modeluitkomsten uit de aangeleverde optieketen en geen officiële koersdoelen. Vooral langere looptijden moeten voorzichtiger worden gelezen wanneer quality of bandvalidatie afneemt.
Algemeen beeld
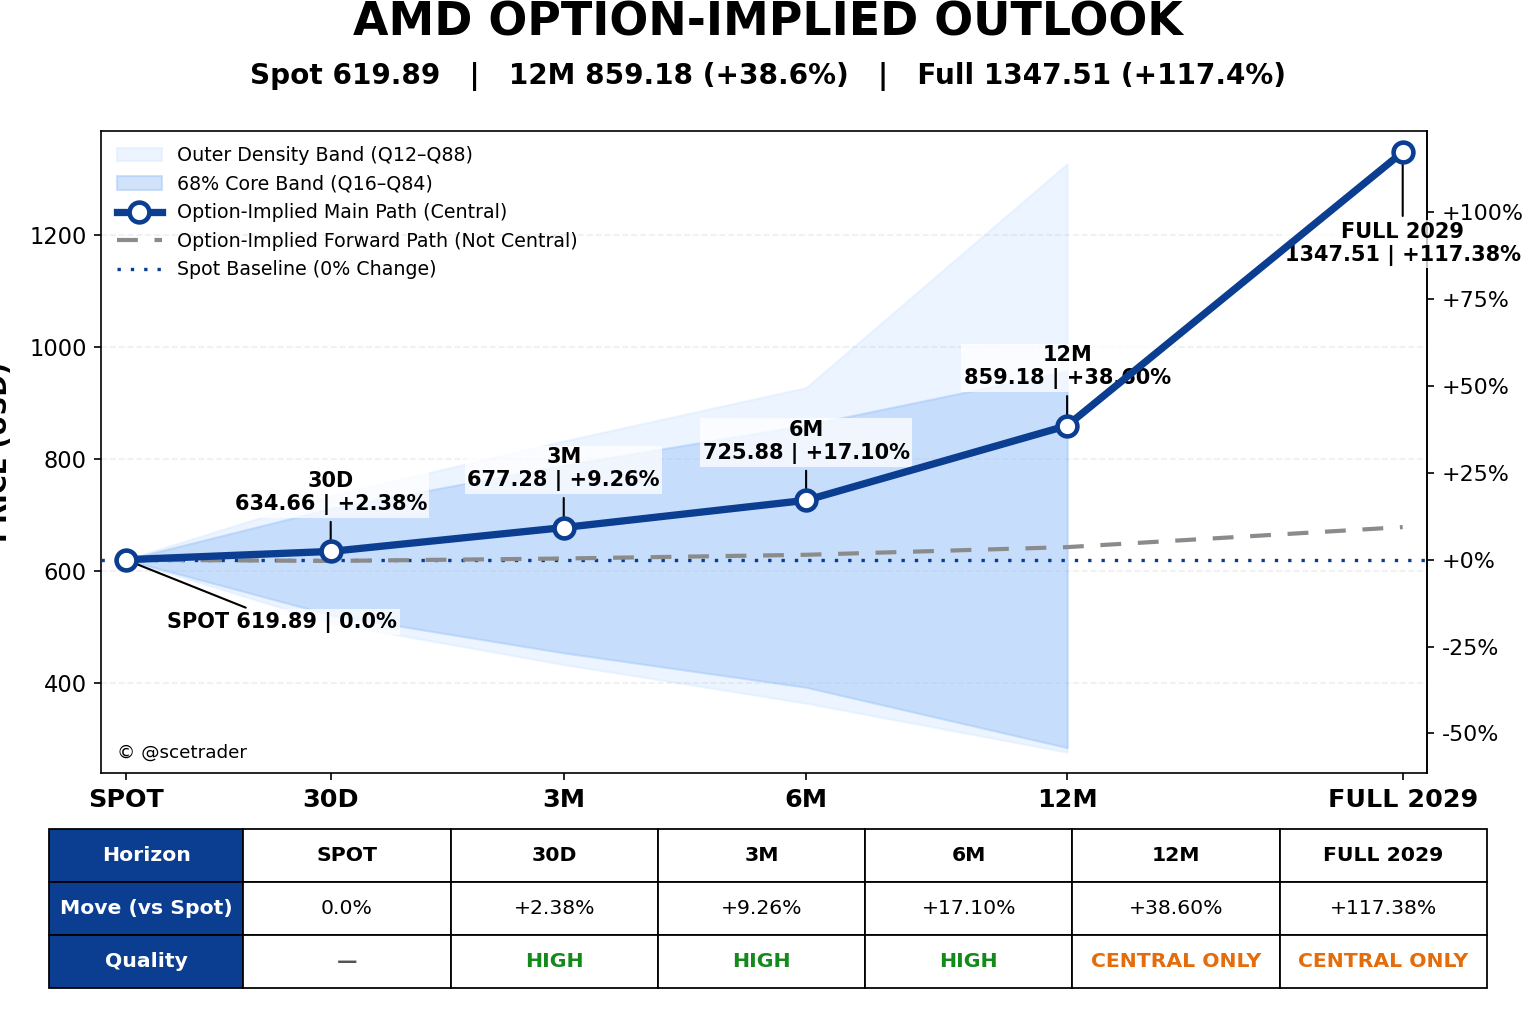
De ATM IV loopt over de vijf horizons grofweg van 55,5% tot 58,5%.
De directionele tilt beweegt van 0,665 op 30D naar 0,018 op FULL 2029; de richting wordt daarmee minder uitgesproken.
Overzicht
| Horizon | Main path | Vanaf spot | Expiry | Quality |
|---|---|---|---|---|
| 30D | 634,66 | +2,38% | 23 oktober 2026 | HIGH |
| 3M | 677,28 | +9,26% | 18 december 2026 | HIGH |
| 6M | 725,88 | +17,10% | 19 maart 2027 | HIGH |
| 12M | 859,18 | +38,60% | 17 september 2027 | CENTRAL ONLY |
| FULL 2029 | 1347,51 | +117,38% | 19 januari 2029 | CENTRAL ONLY |
30 dagen: licht positief
Het centrale niveau ligt op 634,66 dollar, 2,38% boven de huidige koers van 619,89 dollar.
De eerste horizon geeft daarmee een licht positief uitgangspunt voor het verdere koerspad.
De Forward ligt op 617,67 en de ATM IV rond 55,5%. De directionele tilt is 0,665 en daarmee sterk positief.
De bandvalidatie is positief en de quality is HIGH; deze horizon is relatief goed bevestigd.
3 maanden: duidelijke stijging
Het centrale niveau ligt op 677,28 dollar, 9,26% boven de huidige koers van 619,89 dollar.
Ten opzichte van de vorige horizon beweegt het centrale pad 42,62 dollar omhoog. Dat past bij een duidelijke stijging in de optiecurve.
De Forward ligt op 622,04 en de ATM IV rond 58,5%. De directionele tilt is 0,811 en daarmee sterk positief.
De bandvalidatie is positief en de quality is HIGH; deze horizon is relatief goed bevestigd.
6 maanden: duidelijke stijging
Het centrale niveau ligt op 725,88 dollar, 17,10% boven de huidige koers van 619,89 dollar.
Ten opzichte van de vorige horizon beweegt het centrale pad 48,60 dollar omhoog. Dat past bij een duidelijke stijging in de optiecurve.
De Forward ligt op 628,65 en de ATM IV rond 58,0%. De directionele tilt is 0,633 en daarmee sterk positief.
De bandvalidatie is positief en de quality is HIGH; deze horizon is relatief goed bevestigd.
12 maanden: sterke opwaartse sprong
Het centrale niveau ligt op 859,18 dollar, 38,60% boven de huidige koers van 619,89 dollar.
Ten opzichte van de vorige horizon beweegt het centrale pad 133,30 dollar omhoog. Dat past bij een sterke opwaartse sprong in de optiecurve.
De Forward ligt op 642,36 en de ATM IV rond 57,5%. De directionele tilt is 0,424 en daarmee duidelijk positief.
De bandvalidatie is positief en de quality is CENTRAL ONLY; vooral het centrale pad is bruikbaar en extra voorzichtigheid is nodig.
Langste looptijd: sterke opwaartse sprong
Het centrale niveau ligt op 1347,51 dollar, 117,38% boven de huidige koers van 619,89 dollar.
Ten opzichte van de vorige horizon beweegt het centrale pad 488,33 dollar omhoog. Dat past bij een sterke opwaartse sprong in de optiecurve.
De Forward ligt op 678,12 en de ATM IV rond 56,8%. De directionele tilt is 0,018 en daarmee nagenoeg neutraal.
De volledige bandvalidatie ontbreekt en de quality is CENTRAL ONLY; vooral het centrale pad is bruikbaar en extra voorzichtigheid is nodig.
Het volledige koerspad
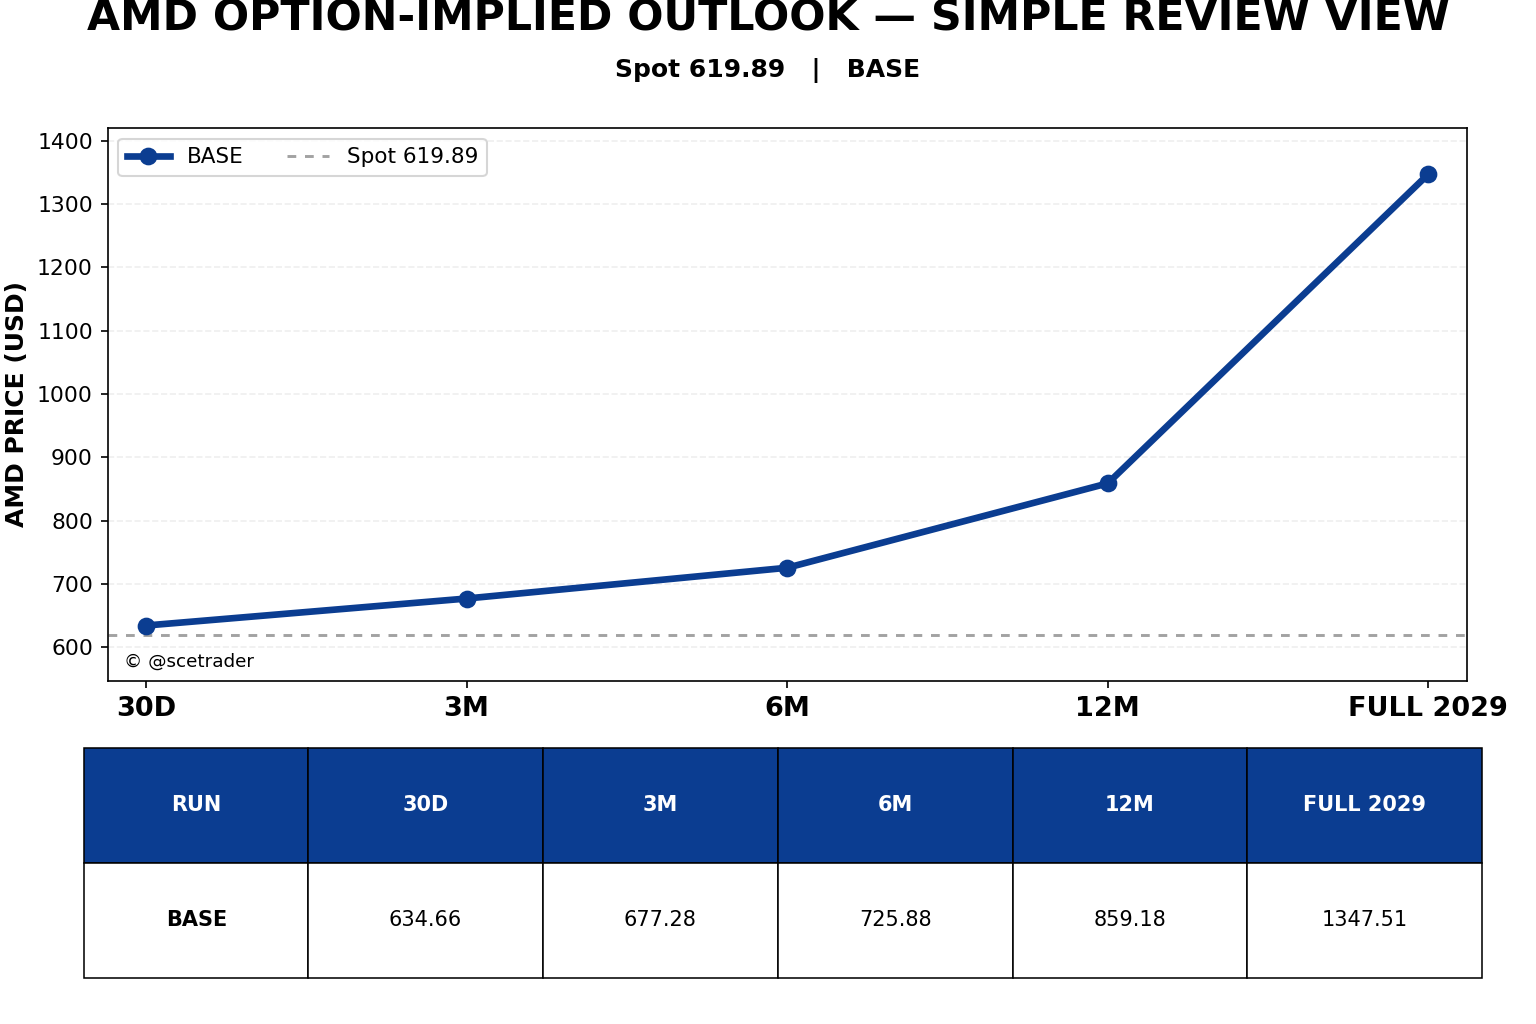
30D→3M: duidelijke stijging; 3M→6M: duidelijke stijging; 6M→12M: sterke opwaartse sprong; 12M→FULL 2029: sterke opwaartse sprong.
De long-end quality is CENTRAL ONLY. De volledige bandvalidatie ontbreekt, waardoor het laatste deel van de curve extra voorzichtig moet worden geïnterpreteerd.
De belangrijkste informatie zit daarom niet alleen in één eindniveau, maar in de opeenvolging van veranderingen tussen de horizons.
English
Advanced Micro Devices: options curve rises and accelerates sharply at the long end
Advanced Micro Devices starts from a reference price of $619.89. 30D→3M: clear rise; 3M→6M: clear rise; 6M→12M: strong upward jump; 12M→FULL 2029: strong upward jump.
These levels are model outputs from the supplied options chain, not official price targets. Longer maturities deserve more caution when quality or band validation weakens.
General view
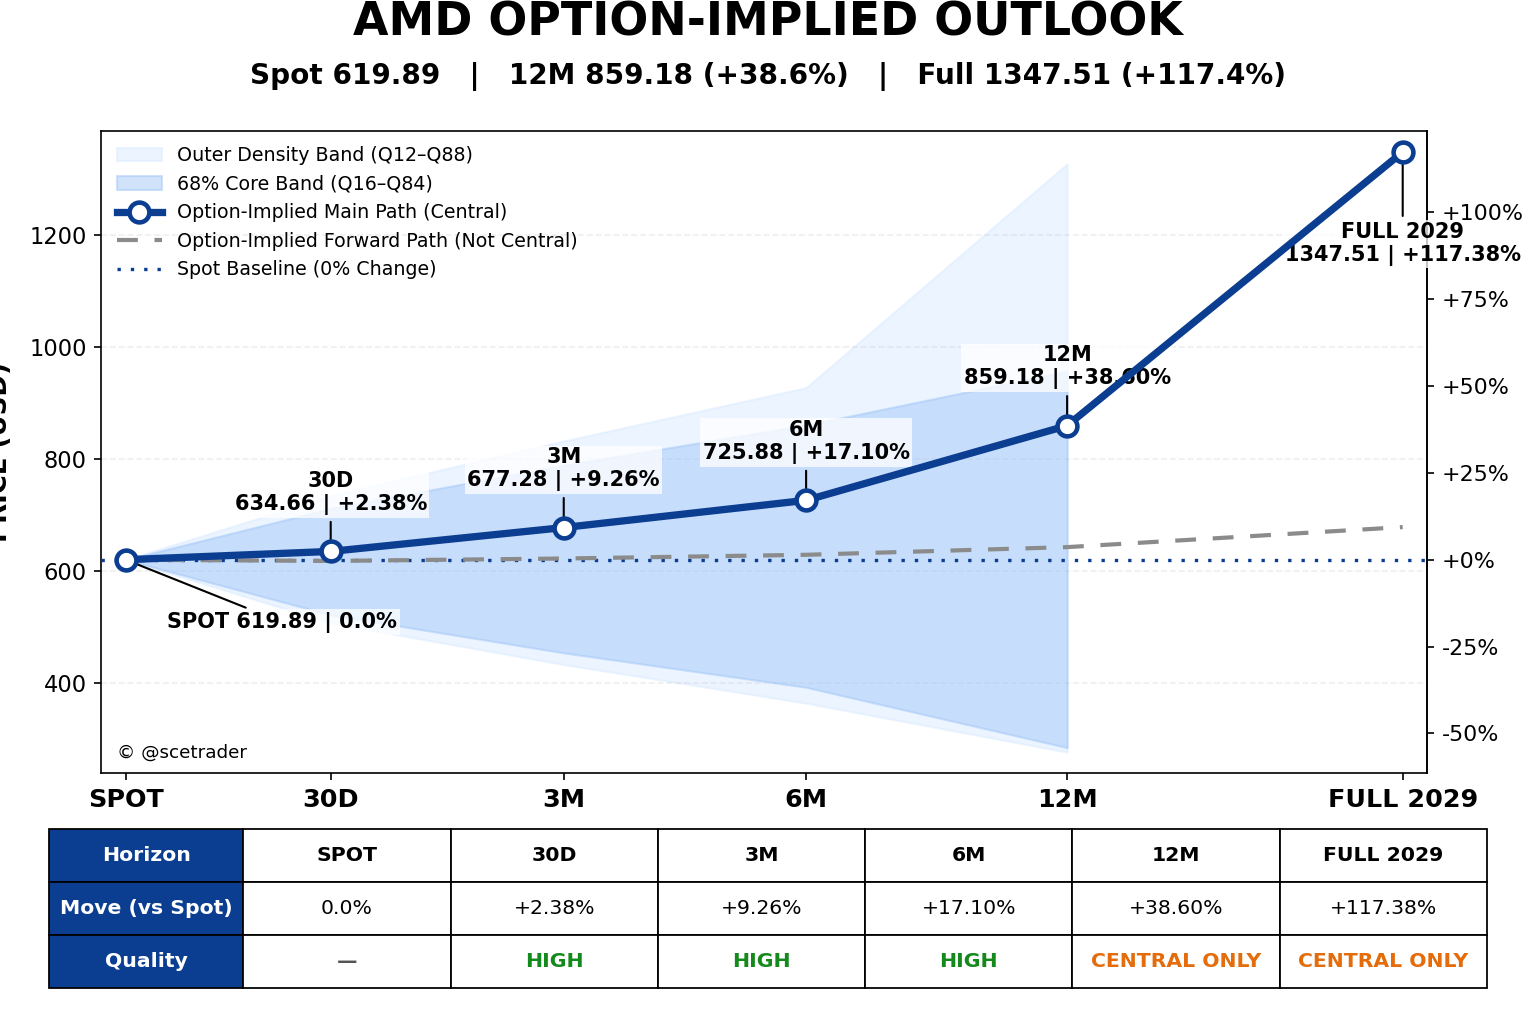
ATM IV ranges roughly from 55.5% to 58.5% across the five horizons.
Directional tilt moves from 0.665 at 30D to 0.018 at FULL 2029; the directional signal therefore becomes less pronounced.
Overview
| Horizon | Main path | From spot | Expiry | Quality |
|---|---|---|---|---|
| 30D | $634.66 | +2.38% | October 23, 2026 | HIGH |
| 3M | $677.28 | +9.26% | December 18, 2026 | HIGH |
| 6M | $725.88 | +17.10% | March 19, 2027 | HIGH |
| 12M | $859.18 | +38.60% | September 17, 2027 | CENTRAL ONLY |
| FULL 2029 | $1347.51 | +117.38% | January 19, 2029 | CENTRAL ONLY |
30 days: mildly positive
The central level is $634.66, 2.38% above the current share price of $619.89.
The first horizon therefore provides a mildly positive starting point for the rest of the path.
The Forward is $617.67 and ATM IV is around 55.5%. Directional tilt is 0.665, which is strongly positive.
Band validation is positive and quality is HIGH; this horizon is relatively well confirmed.
3 months: clear rise
The central level is $677.28, 9.26% above the current share price of $619.89.
Compared with the previous horizon, the central path moves $42.62 higher. That matches a clear rise in the options curve.
The Forward is $622.04 and ATM IV is around 58.5%. Directional tilt is 0.811, which is strongly positive.
Band validation is positive and quality is HIGH; this horizon is relatively well confirmed.
6 months: clear rise
The central level is $725.88, 17.10% above the current share price of $619.89.
Compared with the previous horizon, the central path moves $48.60 higher. That matches a clear rise in the options curve.
The Forward is $628.65 and ATM IV is around 58.0%. Directional tilt is 0.633, which is strongly positive.
Band validation is positive and quality is HIGH; this horizon is relatively well confirmed.
12 months: strong upward jump
The central level is $859.18, 38.60% above the current share price of $619.89.
Compared with the previous horizon, the central path moves $133.30 higher. That matches a strong upward jump in the options curve.
The Forward is $642.36 and ATM IV is around 57.5%. Directional tilt is 0.424, which is clearly positive.
Band validation is positive and quality is CENTRAL ONLY; mainly the central path is usable and additional caution is warranted.
Longest maturity: strong upward jump
The central level is $1347.51, 117.38% above the current share price of $619.89.
Compared with the previous horizon, the central path moves $488.33 higher. That matches a strong upward jump in the options curve.
The Forward is $678.12 and ATM IV is around 56.8%. Directional tilt is 0.018, which is close to neutral.
Full band validation is unavailable and quality is CENTRAL ONLY; mainly the central path is usable and additional caution is warranted.
The full price path
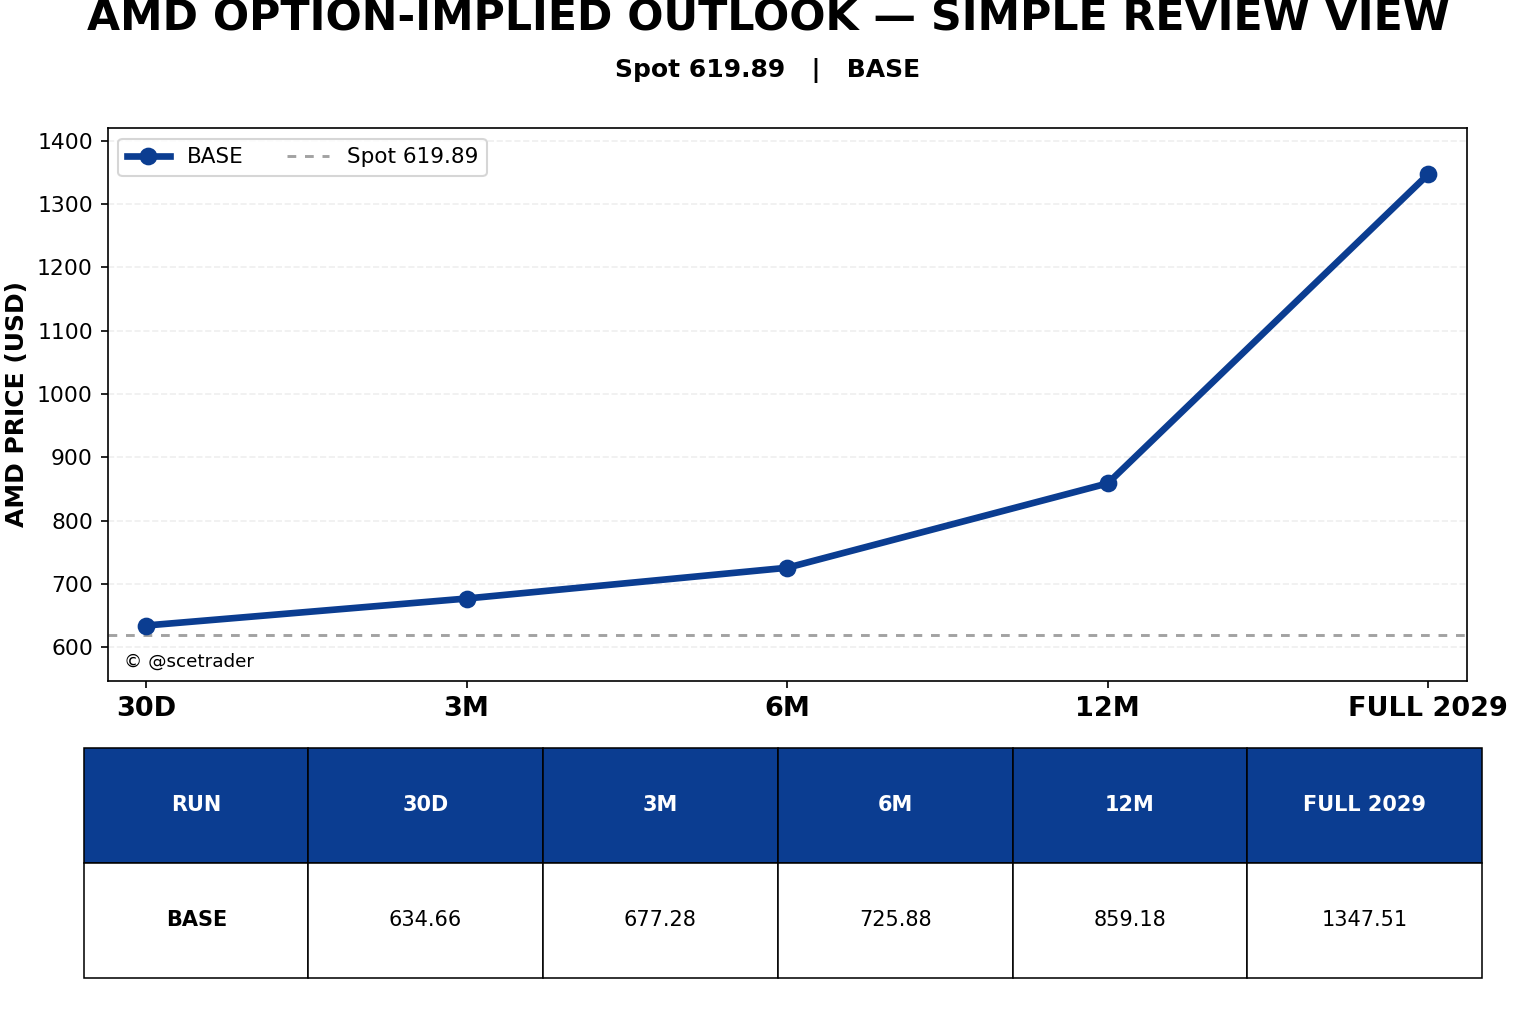
30D→3M: clear rise; 3M→6M: clear rise; 6M→12M: strong upward jump; 12M→FULL 2029: strong upward jump.
Long-end quality is CENTRAL ONLY. Full band validation is unavailable, so the final part of the curve deserves additional caution.
The key information therefore lies not only in one end-point level, but in the sequence of changes across maturities.
Wil je alle artikelen kunnen lezen en elke podcast beluisteren? Neem dan een abonnement en krijg toegang tot alle artikelen en de database met duizenden berichten.
Disclaimer Aan de door ons opgestelde informatie kan op geen enkele wijze rechten worden ontleend. Alle door ons verstrekte informatie en analyses zijn geheel vrijblijvend. Alle consequenties van het op welke wijze dan ook toepassen van de informatie blijven volledig voor uw eigen rekening.
Wij aanvaarden geen aansprakelijkheid voor de mogelijke gevolgen of schade die zouden kunnen voortvloeien uit het gebruik van de door ons gepubliceerde informatie. U bent zelf eindverantwoordelijk voor de beslissingen die u neemt met betrekking tot uw beleggingen.


