🏌️Duolingo -> Grote bewegingen, maar lange termijn nauwelijks hogere koers
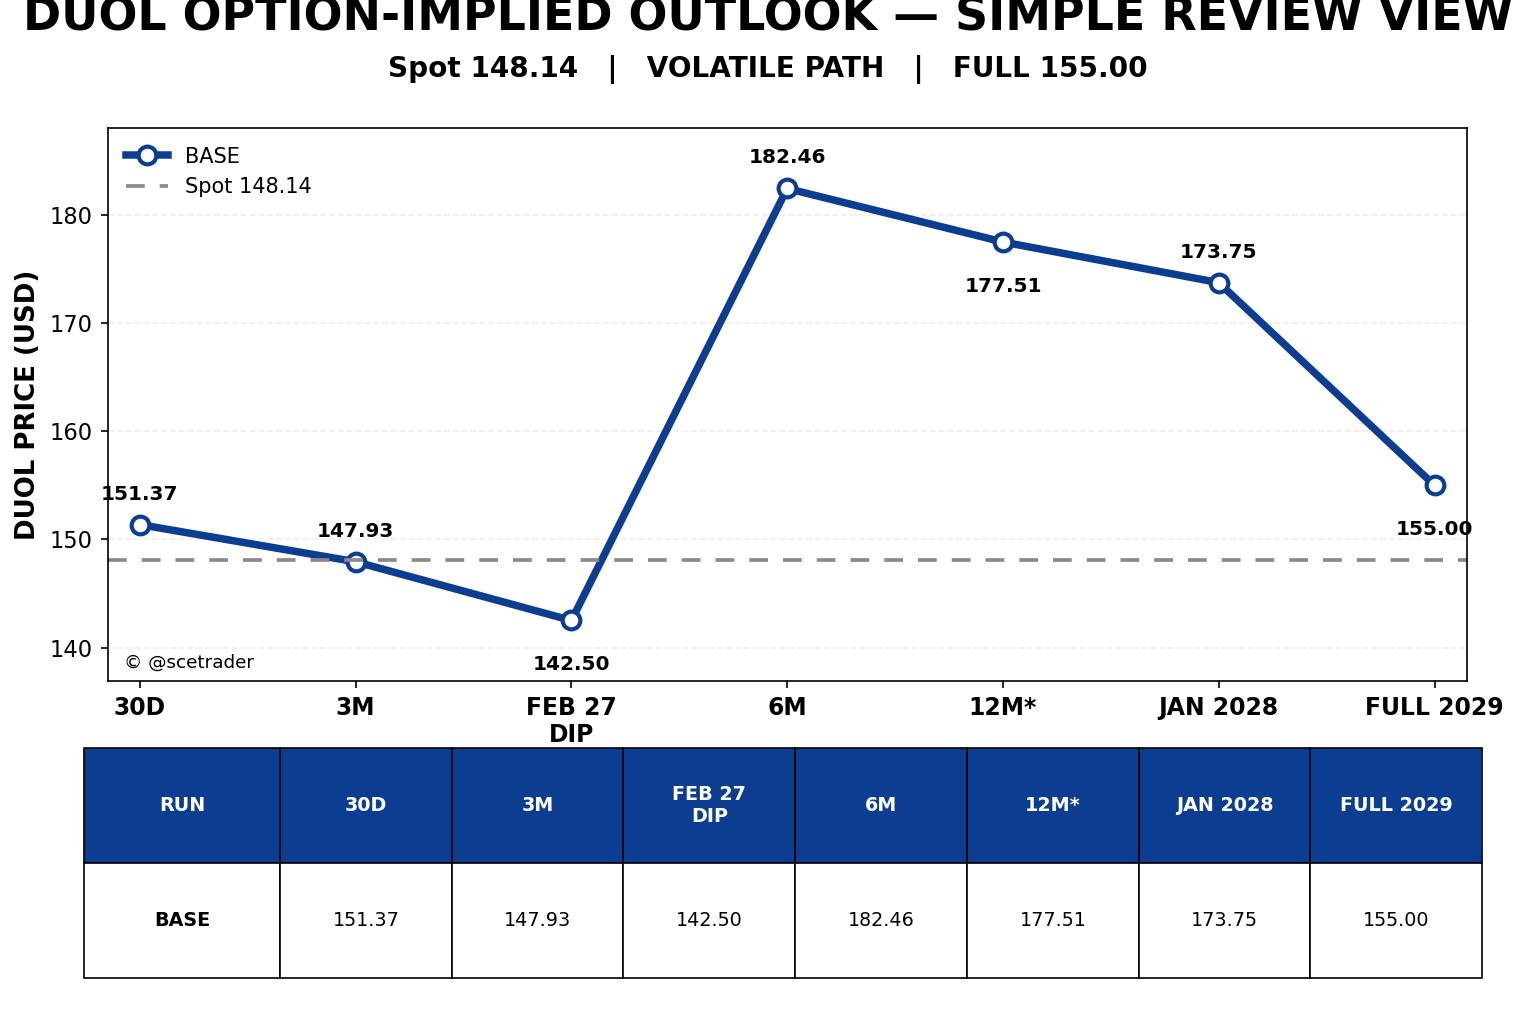
We zijn momenteel in bèta bezig met een model waarmee we aan de hand van opties proberen te berekenen waar de koers van een aandeel theoretisch naartoe zou kunnen bewegen. Het model gebruikt informatie uit verschillende looptijden in de optiemarkt en vertaalt die naar mogelijke koersniveaus voor de komende maanden en jaren.
Heb je vragen stuur gerust een appje, of naar info@scetrader.nl een mail.
De niveaus zijn modeluitkomsten uit de aangeleverde optieketen en geen officiële koersdoelen. Vooral langere looptijden moeten voorzichtiger worden gelezen wanneer quality of bandvalidatie afneemt.
Wil je alle artikelen kunnen lezen en elke podcast beluisteren? Neem dan een abonnement en krijg toegang tot alle artikelen en de database met duizenden berichten.
Duolingo
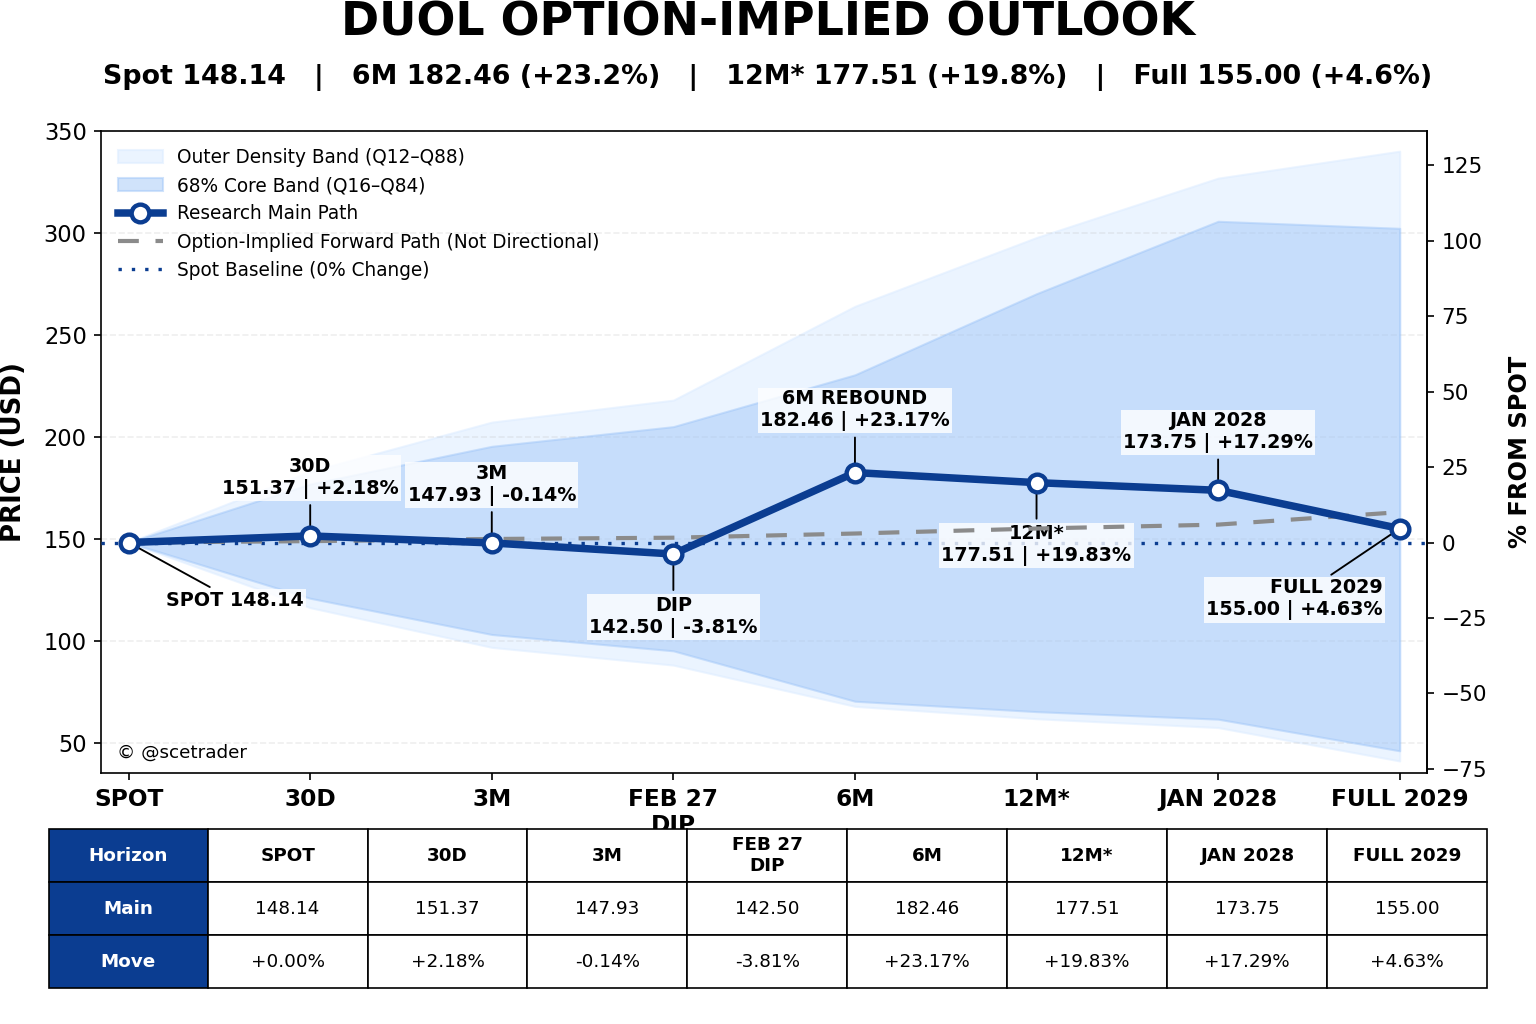
Duolingo noteert in deze analyse op $148,14. De optiecurve geeft een opvallend beeld. Op lange termijn wordt nauwelijks een hogere koers ingeprijsd, maar de weg naar dat eindpunt is allesbehalve rustig. De afzonderlijke expiraties wijzen juist op grote tussentijdse bewegingen, met zowel duidelijke correcties als een sterke herstelbeweging.
Dat onderscheid is belangrijk. FULL 2029 komt in deze analyse uit op ongeveer $155, slechts 4,6% boven de huidige koers. Dat betekent echter niet dat Duolingo tot die tijd rond het huidige niveau blijft liggen. De optiecurve laat onderweg ruimte zien voor een stijging richting ongeveer $180, waarna een deel van die winst weer kan verdwijnen.
De niveaus zijn modeluitkomsten uit de aangeleverde optieketen en geen officiële koersdoelen.
Algemeen beeld
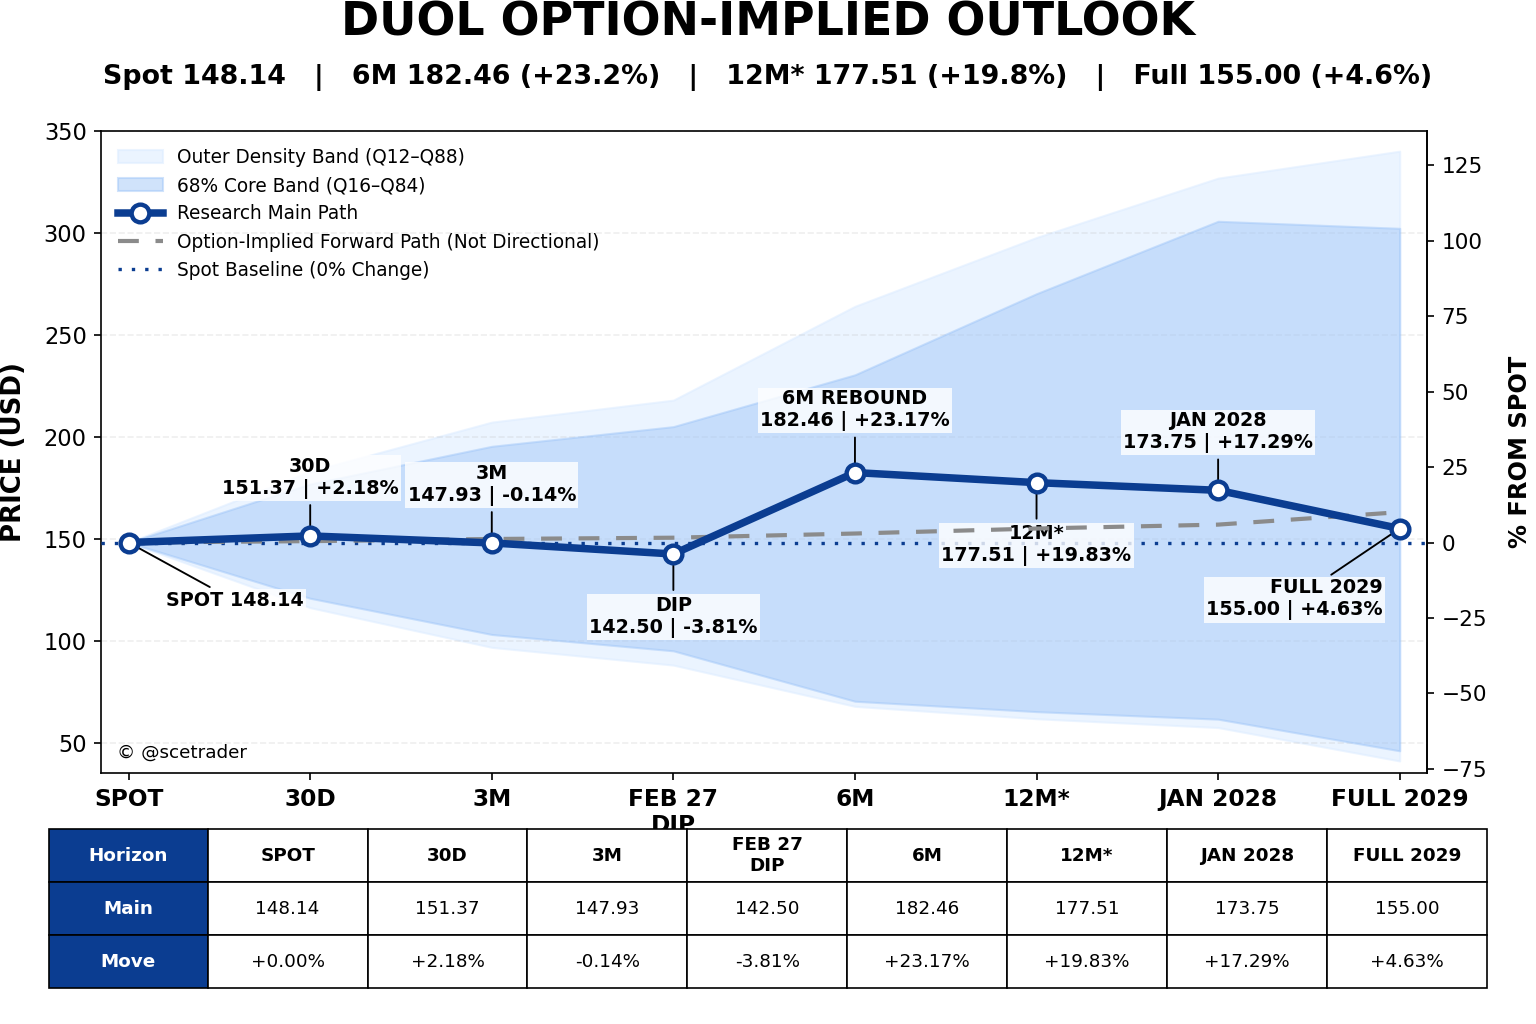
De eerste fase van de curve is onrustig. Vanaf $148,14 ontstaat eerst een beperkte stijging richting ongeveer $151, waarna het aandeel opnieuw terugvalt. Rond februari 2027 ligt een belangrijk zwakker punt rond $142,50.
Daarna verandert het beeld zeer sterk. Op zes maanden komt het centrale pad uit rond $182,46. Vanaf de februari-dip betekent dat een herstel van bijna 28%.
Die beweging houdt echter niet volledig stand. Rond twaalf maanden ligt het centrale niveau weer wat lager op ongeveer $177,51 en richting januari 2028 op $173,75.
Daarna loopt de curve verder terug en eindigt FULL 2029 uiteindelijk rond $155.
Het meest opvallende aan deze structuur is dus niet het eindpunt, maar de enorme beweging onderweg.
Overzicht
| Horizon | Centraal niveau | Vanaf spot |
|---|---|---|
| Spot | $148,14 | 0,00% |
| 30D | $151,37 | +2,18% |
| 3M | $147,93 | -0,14% |
| februari 2027 | $142,50 | -3,81% |
| 6M | $182,46 | +23,17% |
| 12M* | $177,51 | +19,82% |
| januari 2028 | $173,75 | +17,29% |
| FULL 2029 | $155,00 | +4,63% |
30 dagen: eerst beperkte stijging
Op 30 dagen ligt het centrale niveau op $151,37. Dat is ongeveer 2,2% boven de huidige koers.
De korte expiraties zijn echter zeer wisselend. Binnen de eerste maand zien we ook niveaus rond $144 tot $148. De stijging naar $151 moet daarom niet worden gelezen als een stabiele korte trend, maar als onderdeel van een volatiele eerste fase.
De implied volatility blijft hoog. Daardoor kan de werkelijke koersbeweging aanzienlijk groter zijn dan het verschil tussen spot en het centrale niveau.
3 maanden: terug richting de huidige koers
Rond drie maanden komt de centrale lijn weer uit op ongeveer $147,93. Daarmee is vrijwel de gehele eerste stijging verdwenen.
Dit bevestigt dat de optiemarkt op korte termijn geen duidelijke en duurzame opwaartse trend prijst. De verwachte koers blijft in deze fase dicht bij het huidige niveau, maar binnen een brede verdeling.
Februari 2027: zwakke fase
Rond februari 2027 bereikt de centrale curve een tussentijds dieptepunt van ongeveer $142,50.
Vanaf de huidige koers betekent dat slechts een daling van enkele procenten, maar binnen de structuur is dit punt belangrijk. Het vormt de bodem vóór de veel sterkere opwaartse beweging die daarna verschijnt.
Het pad is dus nadrukkelijk niet lineair.
6 maanden: sterke herstelbeweging
De grootste verandering ontstaat richting mei 2027.
Het centrale niveau springt naar ongeveer $182,46. Dat is ruim 23% boven de huidige koers en bijna 28% boven het niveau van de februari-dip.
Dit is de belangrijkste bullish fase binnen de hele curve.
De optieprijzen geven hier ruimte voor een sterke tussentijdse rally, maar de zeer hoge implied volatility betekent dat ook deze uitkomst met brede onzekerheidsbanden moet worden gelezen.
12 maanden: een deel van de winst verdwijnt
Na de sterke beweging richting $182 ontstaat geen nieuwe versnelling omhoog.
Het afgeleide twaalfmaandsniveau ligt rond $177,51. Dat blijft bijna 20% boven de huidige koers, maar ligt alweer onder de zesmaandshorizon.
Dit is precies waarom een simpele rechte lijn voor Duolingo niet werkt. De markt kan gedurende een periode fors stijgen, terwijl de langere expiraties tegelijkertijd aangeven dat niet alle winst behouden blijft.
Januari 2028: verdere afkoeling
Richting januari 2028 zakt het centrale niveau verder naar ongeveer $173,75.
Dat is nog steeds ruim 17% boven de huidige koers, maar opnieuw lager dan de eerdere piek.
De curve wijst daarmee op een scenario waarin Duolingo eerst sterk herstelt en daarna geleidelijk een deel van die stijging weer prijsgeeft.
FULL 2029: nauwelijks hogere koers
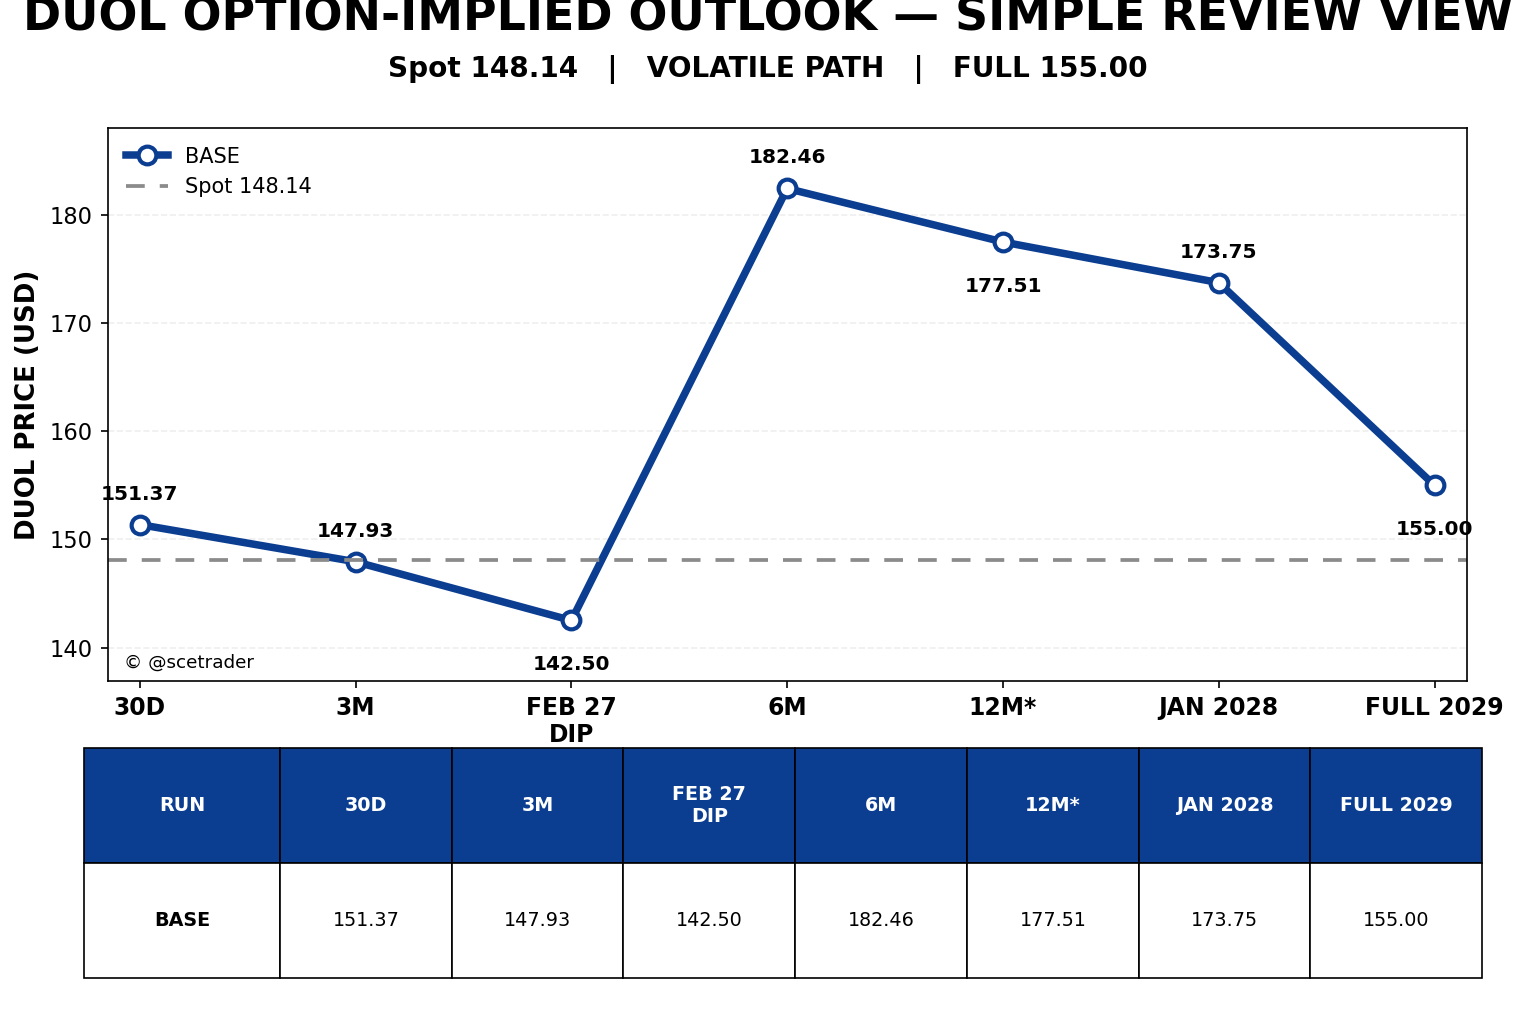
Het belangrijkste langetermijnpunt ligt uiteindelijk rond:
$155
Dat is slechts ongeveer 4,6% boven de huidige koers van $148,14.
FULL vertelt daarmee een heel ander verhaal dan de zesmaandshorizon.
De optiemarkt zegt niet dat Duolingo geen forse stijging kan meemaken. Integendeel: de tussentijdse curve laat duidelijk zien dat een beweging richting $180 mogelijk is.
Maar aan de allerlangste kant blijft van die stijging volgens het centrale pad relatief weinig over.
Waarom FULL zo belangrijk is
Dat verschil tussen de tussentijdse piek en het eindpunt is precies de kern van deze analyse.
Van spot naar de zesmaandshorizon:
$148 → $182
Daarna:
$182 → $178 → $174 → $155
Het model suggereert dus dat een belegger gedurende de looptijd tijdelijk een zeer grote winst kan zien, zonder dat die winst op de langste horizon volledig behouden blijft.
Dat maakt timing bij Duolingo waarschijnlijk belangrijker dan bij een aandeel waarvan de optiecurve geleidelijk en structureel omhoog loopt.
Het volledige koerspad
De centrale lijn is:
$148 → $151 → $148 → $142 → $182 → $178 → $174 → $155
In woorden:
lichte stijging → terugval → tijdelijke zwakte → sterke rally → geleidelijke afkoeling → uiteindelijk nauwelijks hoger dan vandaag.
Dat is de belangrijkste boodschap van deze optionchain.
De hoge implied volatility betekent bovendien dat de echte bewegingen rond dit centrale pad veel groter kunnen zijn. De curve moet dus vooral worden gelezen als een structuur van waarschijnlijke fases en niet als een exacte route die het aandeel stap voor stap zal volgen.
English
Duolingo: major interim moves, but little long-term net upside
Duolingo starts from a reference price of $148.14. The options curve presents an unusual picture. Very little net upside is implied at the longest horizon, yet the path toward that endpoint is anything but stable. Individual maturities indicate substantial interim moves, including both corrections and a strong recovery phase.
That distinction is crucial. FULL 2029 reaches approximately $155, only 4.6% above the current share price. This does not mean Duolingo is expected to remain close to today's price throughout the period. The curve allows for an interim rise toward approximately $180 before a significant portion of those gains is subsequently lost.
These levels are model outputs derived from the supplied options chain and are not official price targets.
General view
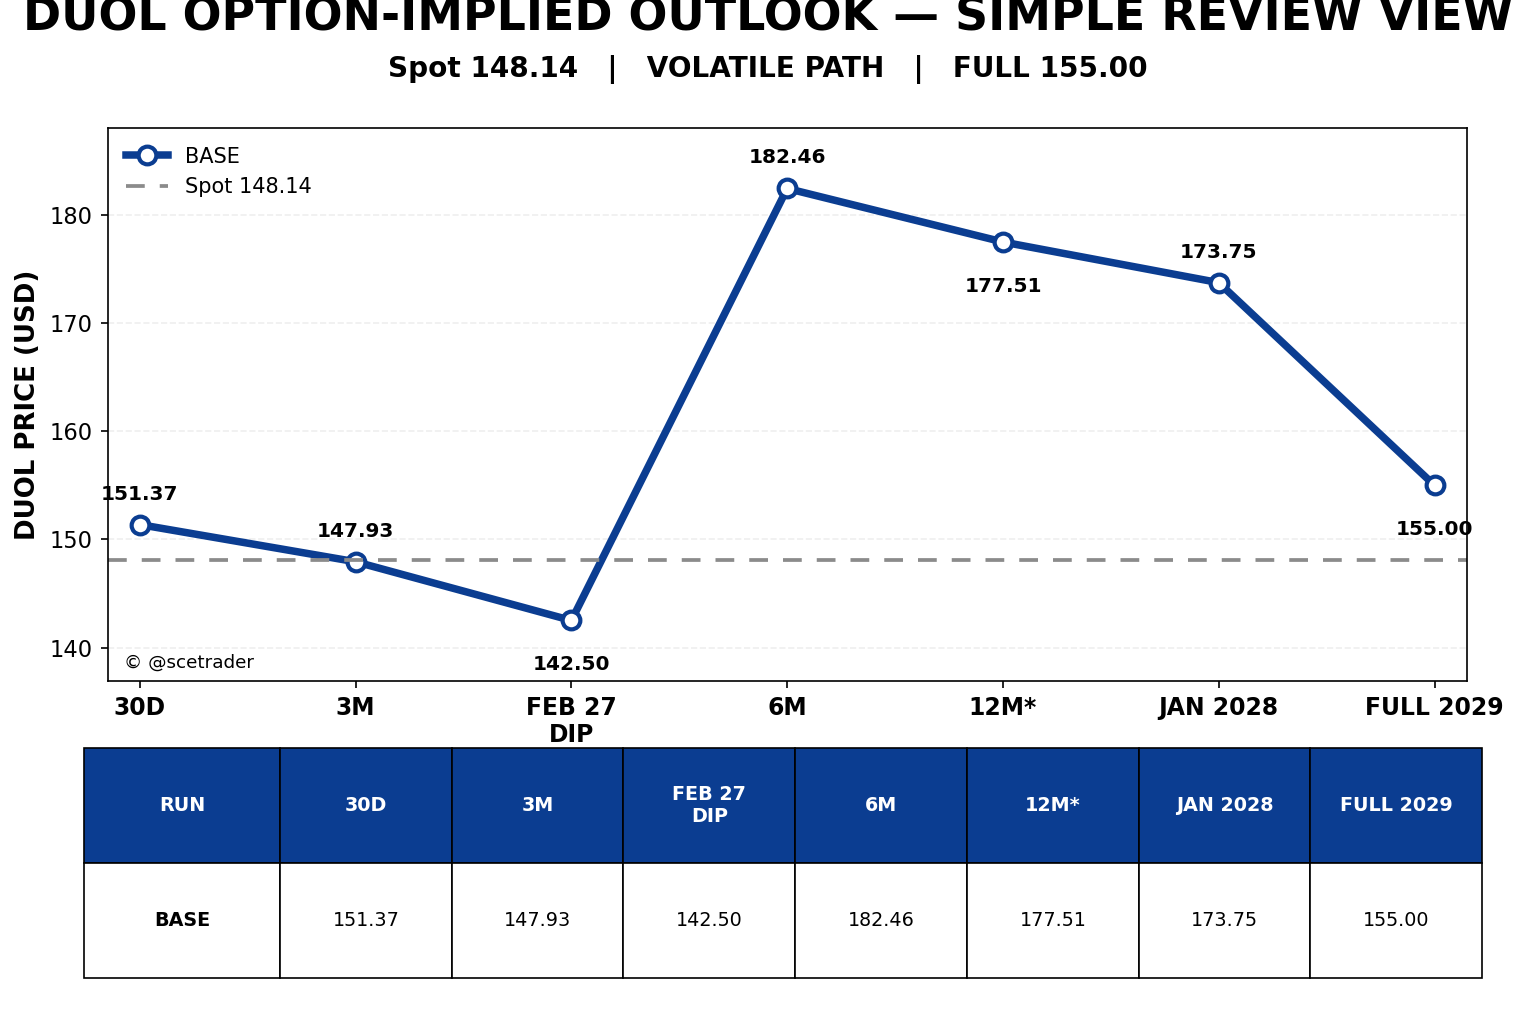
The first part of the curve is volatile. From $148.14, the central path initially rises toward approximately $151 before weakening again. Around February 2027, an important lower point appears near $142.50.
The picture then changes dramatically. At six months, the central path reaches approximately $182.46. From the February low, that represents a recovery of almost 28%.
That move is not fully sustained. The twelve-month central level declines to approximately $177.51 and January 2028 falls further to $173.75.
The curve then continues to cool and FULL 2029 ultimately ends around $155.
The most important feature is therefore not the final level, but the size of the moves along the way.
Overview
| Horizon | Central level | From spot |
|---|---|---|
| Spot | $148.14 | 0.00% |
| 30D | $151.37 | +2.18% |
| 3M | $147.93 | -0.14% |
| February 2027 | $142.50 | -3.81% |
| 6M | $182.46 | +23.17% |
| 12M* | $177.51 | +19.82% |
| January 2028 | $173.75 | +17.29% |
| FULL 2029 | $155.00 | +4.63% |
30 days: limited initial rise
At 30 days, the central level reaches $151.37, approximately 2.2% above the current share price.
Ultra-short expirations remain highly mixed, however, with levels also appearing around $144 to $148. The move toward $151 should therefore not be interpreted as a stable short-term trend, but as part of a volatile initial phase.
Implied volatility remains elevated, meaning realized price movement could be substantially greater than the difference between spot and the central level.
3 months: back toward the current price
Around three months, the central path returns to approximately $147.93. Almost all of the initial rise has therefore disappeared.
This confirms that the short-term options structure does not price a clear and sustained upward trend. The central expectation remains near spot, although within a very broad distribution.
February 2027: weak phase
Around February 2027, the central curve reaches an interim low of approximately $142.50.
That represents only a modest decline from today's price, but structurally it is important. It forms the low before the significantly stronger upward move that follows.
The path is therefore clearly non-linear.
6 months: strong recovery
The largest change appears toward May 2027.
The central level rises to approximately $182.46. That is more than 23% above the current share price and almost 28% above the February low.
This is the strongest bullish phase in the entire curve.
The options market therefore allows for a major interim rally, although high implied volatility means the result remains surrounded by a very wide range of possible outcomes.
12 months: some of the gains disappear
After the move toward $182, the curve does not accelerate further.
The derived twelve-month central level falls to approximately $177.51. That remains almost 20% above the current share price, but is already below the six-month level.
This is precisely why a simple straight-line projection does not work for Duolingo. The stock can appreciate substantially during part of the period while longer maturities simultaneously suggest that not all of those gains will be retained.
January 2028: further cooling
By January 2028, the central level declines further to approximately $173.75.
That remains more than 17% above the current share price, but is again below the earlier peak.
The curve therefore suggests a strong recovery followed by a gradual surrender of part of that advance.
FULL 2029: little net upside
The most important long-term point ultimately sits around:
$155
That is only approximately 4.6% above the current $148.14 share price.
FULL therefore tells a very different story from the six-month horizon.
The options structure does not suggest that Duolingo is incapable of producing substantial gains. On the contrary, the interim curve clearly allows for a move toward $180.
But at the longest horizon, relatively little of that upside remains in the central path.
Why FULL matters
The gap between the interim peak and the terminal point is the core of the analysis.
From spot to six months:
$148 → $182
After that:
$182 → $178 → $174 → $155
The model therefore implies that an investor could temporarily experience a very substantial gain without that gain being fully preserved at the longest horizon.
For Duolingo, timing may therefore matter considerably more than for a stock whose options curve rises gradually and consistently over time.
The full price path
The central path is:
$148 → $151 → $148 → $142 → $182 → $178 → $174 → $155
In structural terms:
mild rise → pullback → temporary weakness → strong rally → gradual cooling → ultimately only slightly above today's price.
That is the central message from this options chain.
High implied volatility also means realized moves around this central path can be much larger. The curve should therefore primarily be interpreted as a sequence of potential phases rather than an exact path the stock is expected to follow step by step.
Disclaimer Aan de door ons opgestelde informatie kan op geen enkele wijze rechten worden ontleend. Alle door ons verstrekte informatie en analyses zijn geheel vrijblijvend. Alle consequenties van het op welke wijze dan ook toepassen van de informatie blijven volledig voor uw eigen rekening.
Wij aanvaarden geen aansprakelijkheid voor de mogelijke gevolgen of schade die zouden kunnen voortvloeien uit het gebruik van de door ons gepubliceerde informatie. U bent zelf eindverantwoordelijk voor de beslissingen die u neemt met betrekking tot uw beleggingen.


