📊 SAP: Correctierisico bij uptrend neemt toe na sterk herstel
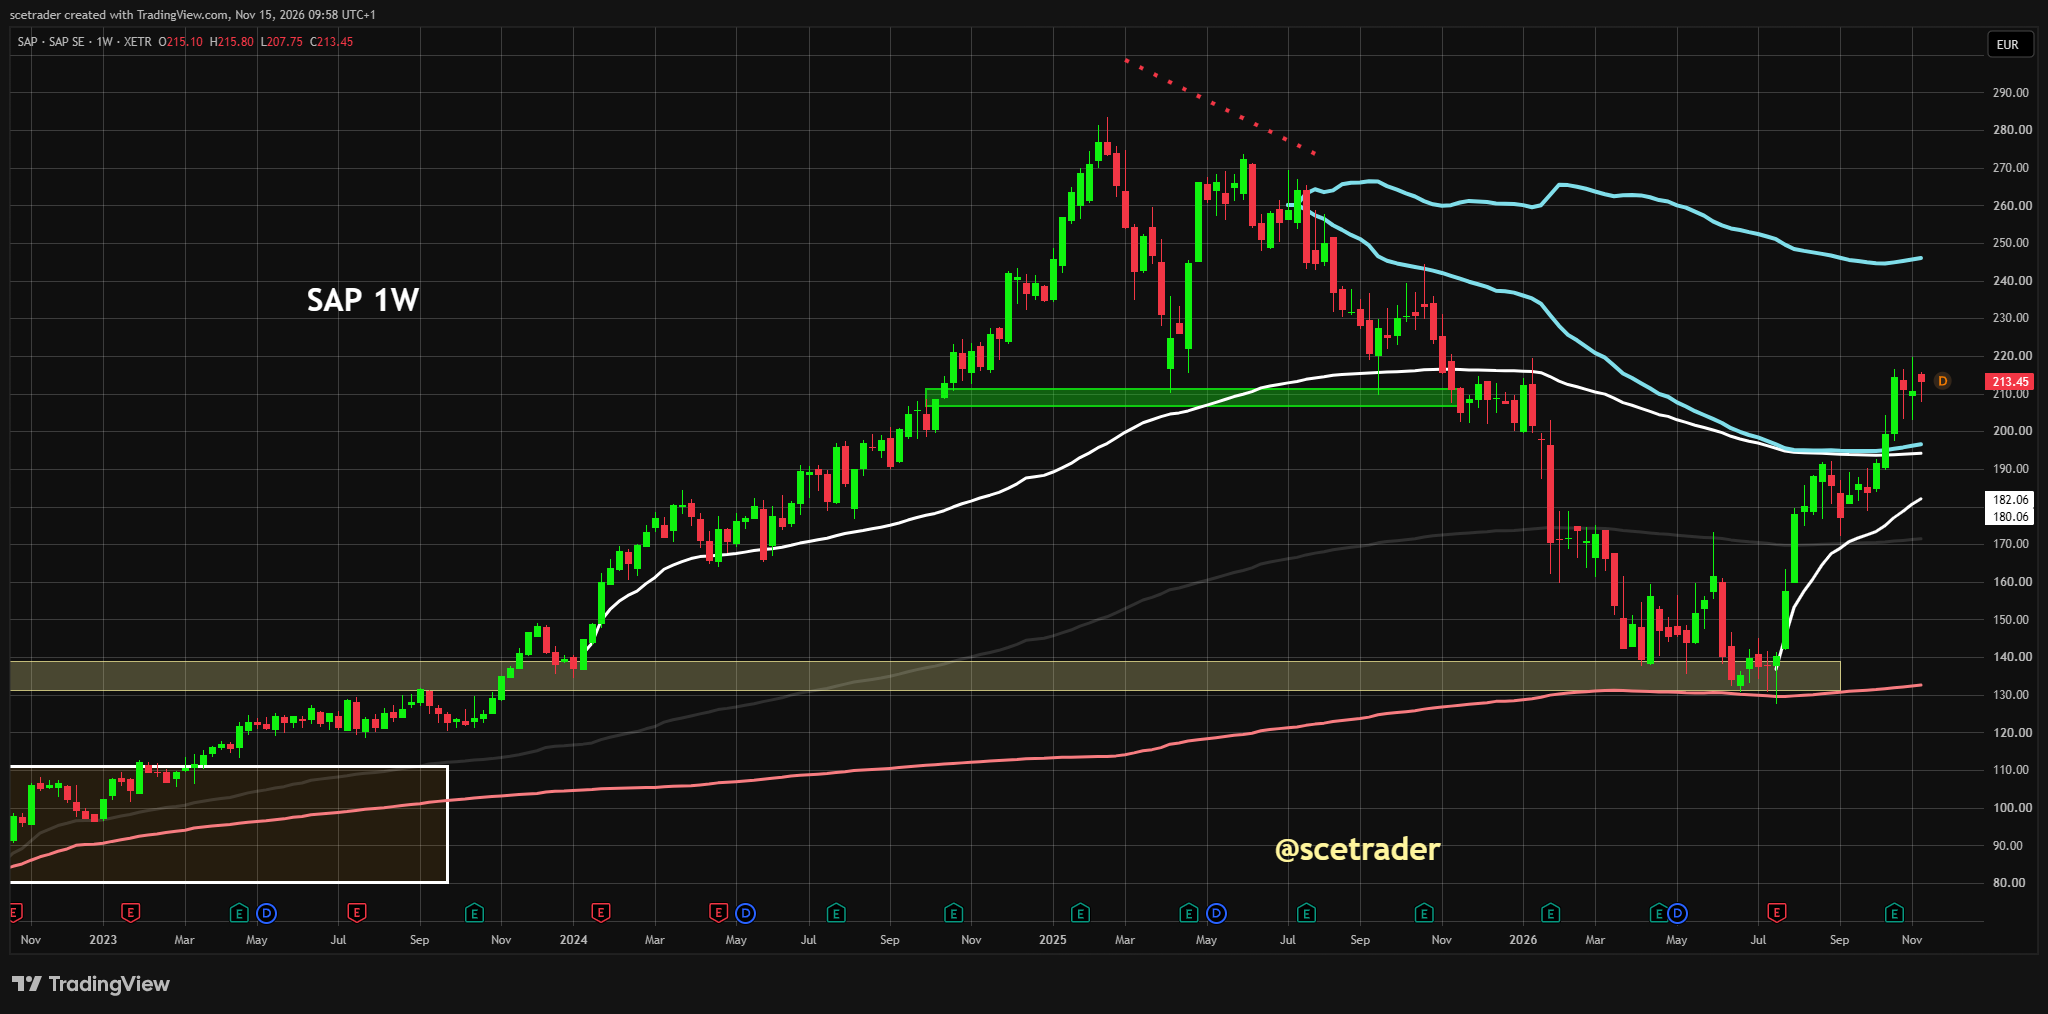
SAP is op de weekgrafiek sterk hersteld vanaf de zone rond €130–€140 en noteert nu rond €213,5. Door de snelheid en omvang van die stijging is de kans op een tussentijdse correctie duidelijk toegenomen, waarbij de VWAP- en bandcluster rond €194–€197 de belangrijkste eerste test vormt.
■ Richting: technisch positief, maar de kans op een correctie is na het sterke herstel duidelijk groter geworden.
■ Rond €194–€197 komen een witte VWAP en een lichtblauwe upper band dicht bij elkaar. Een terugtest richting ongeveer €195 is na deze stijging realistisch en hoeft de opwaartse structuur niet te breken.
■ De reactie rond €194–€197 wordt cruciaal. Houdt deze steunzone stand en verschijnen daar opnieuw kopers, dan blijft de opwaartse structuur intact.
■ In dat scenario ligt de hoogste lichtblauwe upper band rond €245–€248 als volgend technisch doel op de grafiek.
■ Een neerwaartse breuk onder ongeveer €194 zou het beeld verzwakken en de volgende witte VWAP rond €182,1 opnieuw relevant maken.
■ Onder €182,1 neemt het risico op een duidelijk diepere correctie verder toe.
Investment View: wij blijven technisch positief, maar de kans op een correctie is na het sterke herstel duidelijk toegenomen. Een terugval richting ongeveer €195 zou technisch logisch zijn. Als de cluster rond €194–€197 vervolgens standhoudt en de koers opnieuw opveert, ligt de hoogste lichtblauwe upper band rond €245–€248 als volgende technische doelzone voor de hand. Deze technische analyse staat los van eventuele bestaande posities en kan afwijken van andere berichtgeving of eerder ingenomen marktvisies.
🔵 English version
SAP: correction risk increases after strong recovery
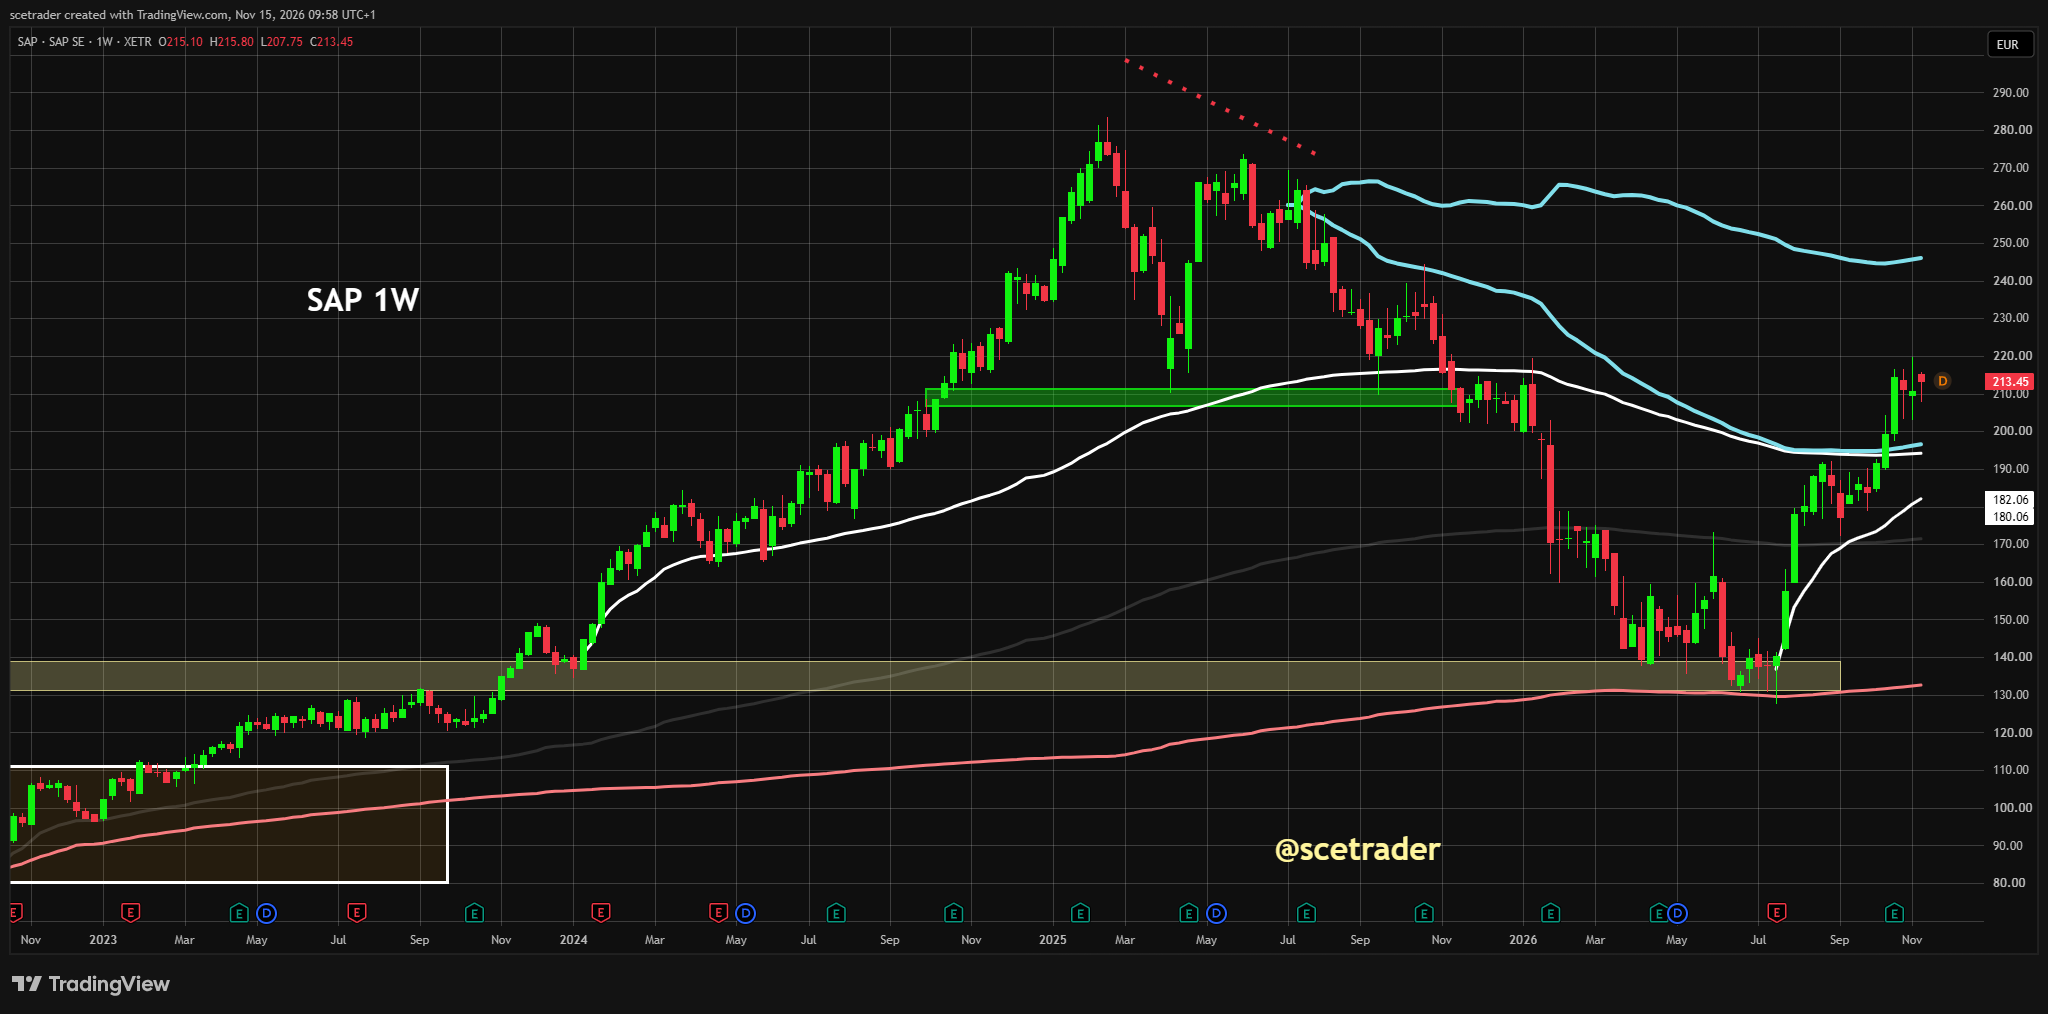
SAP has recovered strongly from the €130–€140 area on the weekly chart and is now trading around €213.5. Because of the speed and magnitude of that advance, the probability of an intermediate correction has clearly increased, with the VWAP and band cluster around €194–€197 representing the most important first test.
■ Direction: technically positive, but the probability of a correction has clearly increased after the strong recovery.
■ Around €194–€197, a white VWAP and a light-blue upper band converge. A retest toward roughly €195 would be realistic after this advance and would not break the upward structure by itself.
■ The reaction around €194–€197 will be crucial. If this support area holds and buyers return, the upward structure remains intact.
■ In that scenario, the highest light-blue upper band around €245–€248 becomes the next technical target on the chart.
■ A downside break below roughly €194 would weaken the picture and bring the next white VWAP around €182.1 back into focus.
■ Below €182.1, the risk of a significantly deeper correction would increase further.
Investment View: we remain technically positive, but the probability of a correction has clearly increased after the strong recovery. A pullback toward roughly €195 would be technically logical. If the €194–€197 cluster then holds and the price rebounds, the highest light-blue upper band around €245–€248 becomes the next logical technical target zone. This technical analysis is independent of any existing positions and may differ from other reporting or previously held market views.
Disclaimer Aan de door ons opgestelde informatie kan op geen enkele wijze rechten worden ontleend. Alle door ons verstrekte informatie en analyses zijn geheel vrijblijvend. Alle consequenties van het op welke wijze dan ook toepassen van de informatie blijven volledig voor uw eigen rekening.
Wij aanvaarden geen aansprakelijkheid voor de mogelijke gevolgen of schade die zouden kunnen voortvloeien uit het gebruik van de door ons gepubliceerde informatie. U bent zelf eindverantwoordelijk voor de beslissingen die u neemt met betrekking tot uw beleggingen.


