📊 LightPath: Dalende VWAP's houden het technische beeld bearish
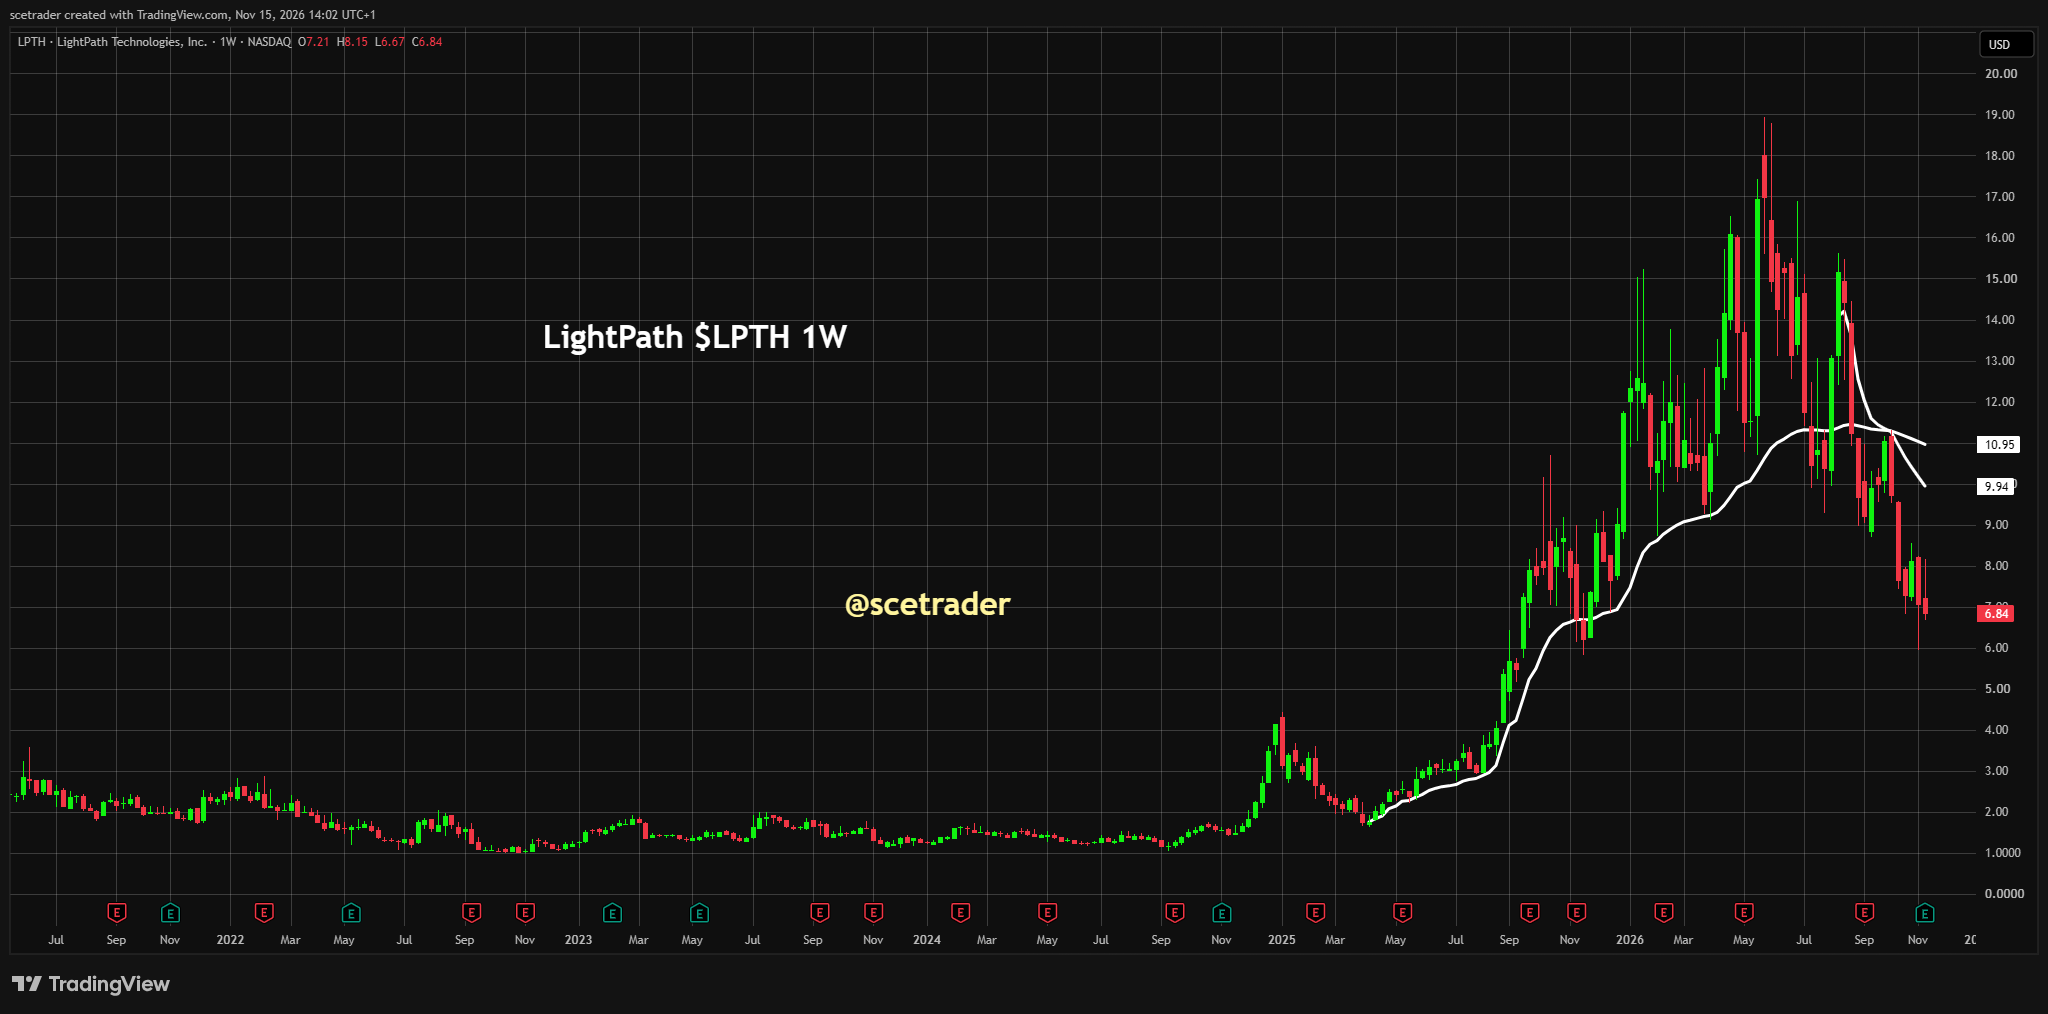
LightPath noteert op de weekgrafiek rond $6,8 en blijft in een duidelijke neerwaartse structuur van lagere toppen en lagere bodems. Beide witte VWAPs dalen boven de koers, waardoor zelfs een stevige herstelbeweging voorlopig vooral richting dynamische weerstand zou lopen.
■ Richting: bearish. De huidige week liep op tot $8,2, maar de koers viel daarna terug naar $6,8 en noteerde tussentijds $6,7. Dat laat zien dat verkopers bij herstel nog snel terugkeren.
■ De eerste witte VWAP ligt rond $9,9 en daalt relatief scherp. Een rally richting deze lijn kan daardoor fors ogen vanaf de huidige koers, maar technisch nog steeds slechts een herstel binnen de neerwaartse trend zijn.
■ De tweede witte VWAP ligt rond $11,0 en daalt eveneens. Ook een beweging richting dit niveau hoeft het bearish beeld niet te veranderen en kan opnieuw zware verkoopdruk aantrekken.
■ Samen vormen de dalende VWAPs rond $9,9–$11,0 een belangrijke dynamische weerstandszone. Juist een krachtige rally richting deze zone kan daarom interessant worden als plek waar een volgende neerwaartse beweging ontstaat.
■ Rond $6,5–$7,0 ligt de eerste zichtbare steun. De koers test deze zone nu al, waardoor hier moet blijken of er voldoende vraag is om ten minste een technische herstelbeweging te starten.
■ Een overtuigende breuk onder ongeveer $6,5 zou het beeld verder verzwakken. Dan komt de eerdere uitbraakzone rond grofweg $5,5–$6,0 als volgende technische steun in beeld.
■ Zolang de koers onder de dalende VWAP-structuur blijft en lagere toppen blijft vormen, is er op deze grafiek geen overtuigend signaal dat de neerwaartse fase voorbij is.
Investment View: wij blijven technisch negatief. LightPath staat ver onder twee dalende VWAPs en de huidige prijsactie laat zien dat herstelpogingen nog snel worden verkocht. Een rally richting $9,9–$11,0 zou procentueel fors kunnen zijn, maar kan technisch juist opnieuw een verkoopzone worden. Aan de onderkant is $6,5–$7,0 nu de eerste test. Breekt die zone, dan komt ongeveer $5,5–$6,0 als volgende steun in beeld. Deze technische analyse staat los van eventuele bestaande posities en kan afwijken van andere berichtgeving of eerder ingenomen marktvisies.
🔵 English version
LightPath: declining VWAPs keep the technical picture bearish
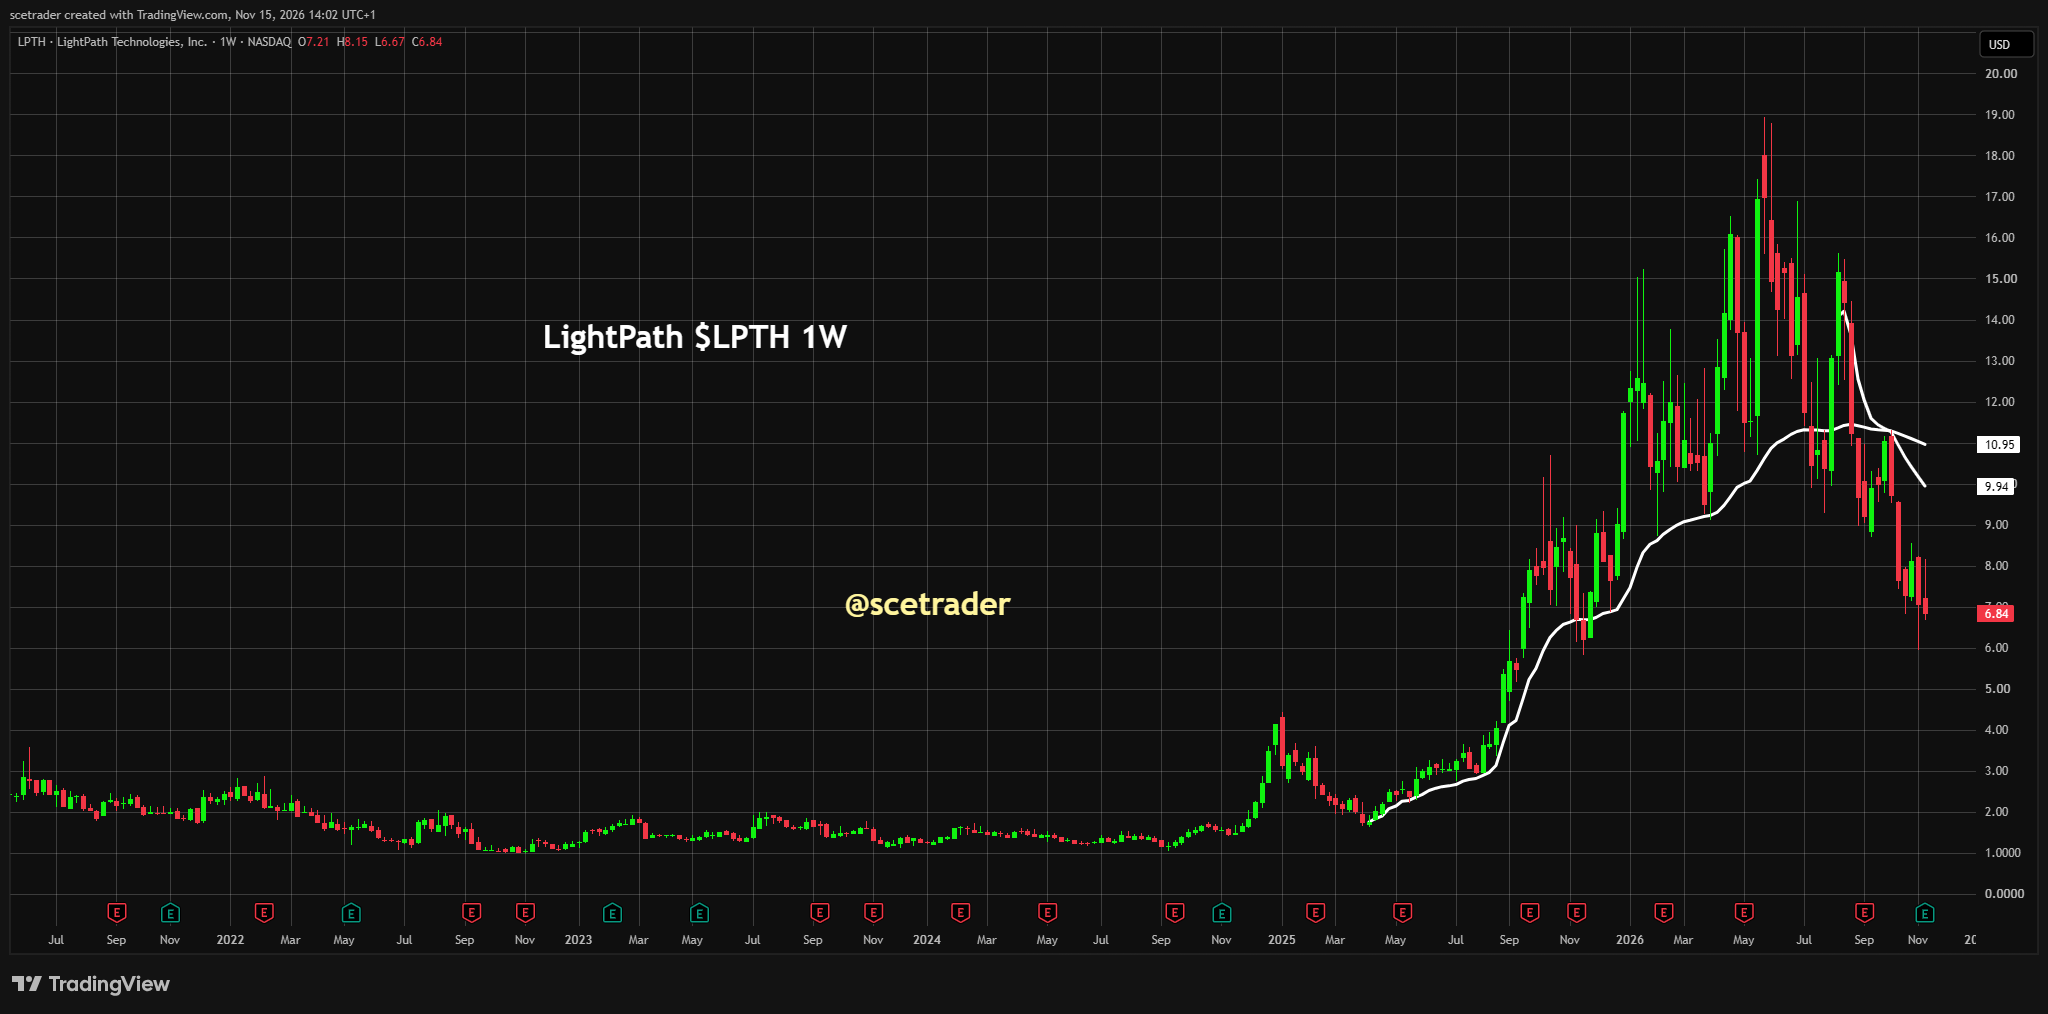
LightPath is trading around $6.8 on the weekly chart and remains in a clear downward structure of lower highs and lower lows. Both white VWAPs are declining above the price, meaning that even a strong recovery would initially run into dynamic resistance.
■ Direction: bearish. The current week reached as high as $8.2 before falling back to $6.8, with an intraperiod low around $6.7. This shows that sellers are still returning quickly into strength.
■ The first white VWAP sits around $9.9 and is declining relatively steeply. A rally toward this line could look substantial from the current price, but technically it could still be nothing more than a recovery within the downtrend.
■ The second white VWAP sits around $11.0 and is also declining. Even a move toward this level would not necessarily change the bearish picture and could attract renewed heavy selling pressure.
■ Together, the declining VWAPs around $9.9–$11.0 form an important dynamic resistance zone. A powerful rally toward this area could therefore become the point from which another downside move develops.
■ The first visible support sits around $6.5–$7.0. The price is already testing this area, making the reaction here important in determining whether at least a technical recovery can develop.
■ A convincing break below roughly $6.5 would weaken the structure further. The previous breakout area around approximately $5.5–$6.0 would then become the next technical support.
■ As long as the price remains below the declining VWAP structure and continues to produce lower highs, this chart offers no convincing signal that the downward phase has ended.
Investment View: we remain technically negative. LightPath is trading well below two declining VWAPs and the current price action shows that recovery attempts are still being sold quickly. A rally toward $9.9–$11.0 could be substantial in percentage terms, but technically it could instead become another selling zone. On the downside, $6.5–$7.0 is the first test. If that area fails, approximately $5.5–$6.0 becomes the next support. This technical analysis is independent of any existing positions and may differ from other reporting or previously held market views.
Disclaimer Aan de door ons opgestelde informatie kan op geen enkele wijze rechten worden ontleend. Alle door ons verstrekte informatie en analyses zijn geheel vrijblijvend. Alle consequenties van het op welke wijze dan ook toepassen van de informatie blijven volledig voor uw eigen rekening.
Wij aanvaarden geen aansprakelijkheid voor de mogelijke gevolgen of schade die zouden kunnen voortvloeien uit het gebruik van de door ons gepubliceerde informatie. U bent zelf eindverantwoordelijk voor de beslissingen die u neemt met betrekking tot uw beleggingen.


